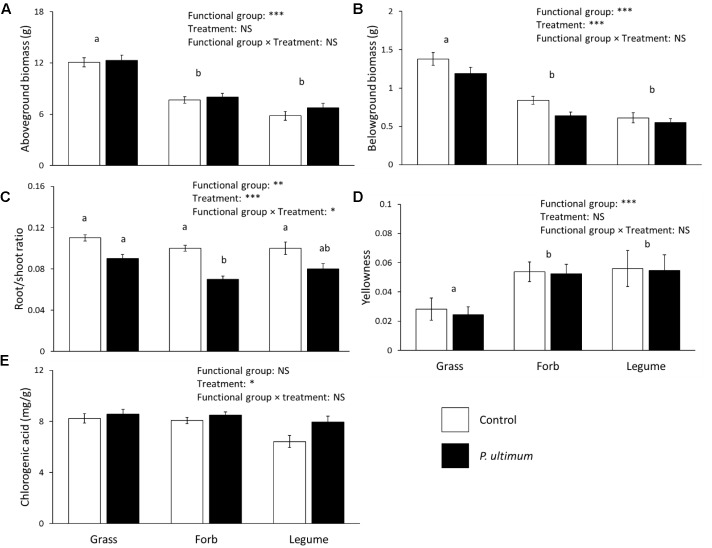
FIGURE 3.
Effects of plant functional group and pathogen addition on chrysanthemum aboveground biomass (A), belowground biomass (B), root/shoot ratio (C), proportion of yellow leaves (D), and leaf chlorogenic acid concentration (E). Data show means ± SE, with white bars representing control soil, and black bars representing the P. ultimum treatment. Different letters indicate significant differences between functional groups (P < 0.05). For root/shoot ratio, different letters above bars indicate significant differences (P < 0.05). Full statistics are listed in Table 2.

