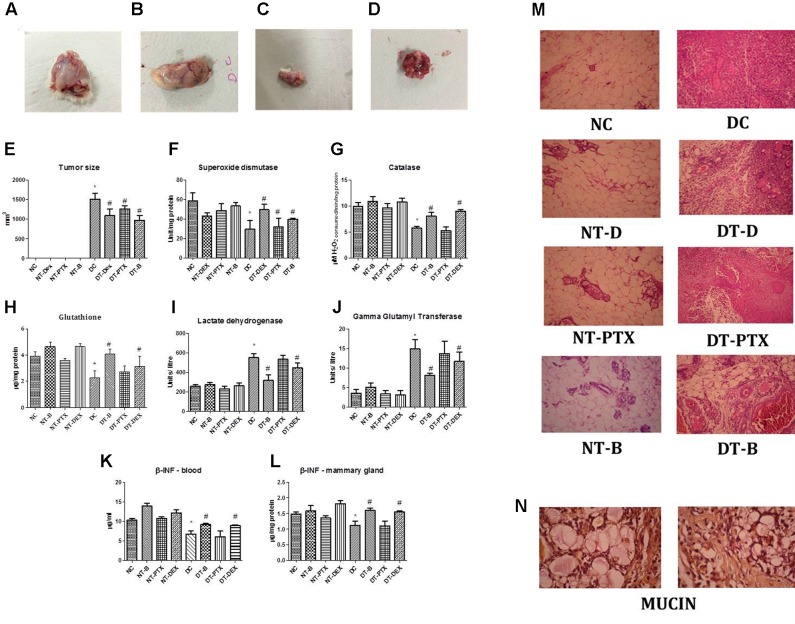
FIGURE 3.
Representative photograph of tumor regression analysis in DMBA induced mammary cancer animal model; (A) positive control mammary gland, (B) rats treated with paclitaxel, (C) rats treated with β-interferon and (D) rats treated with DEAE-Dextran. (E) Graphical representation of tumor size. Biochemical estimations in DMBA induced mammary cancer model; (F) superoxide levels, (G) catalase levels, (H) glutathione (GSH) levels, (I) lactate dehydrogenase (LDH) levels, (J) gamma glutamyl transferase (GGT) levels, (K) β-interferon levels in blood and (L) β-interferon levels in mammary gland. (M) Histopathological studies in DMBA induced mammary cancer model (HE staining), magnification X250. (N) Histopathological studies with Mayer’s mucicarmine stain in positive control sections, magnification X400. ∗Significantly different from control animals (P < 0.05), #Significantly different from positive control (P < 0.05), each group consists of six animals, Values expressed as Mean ± SEM. NC – control rats, DC – positive control, DT-Dex – 100 mg/kg DEAE-Dextran treated, DT-PTX – 30 mg/kg paclitaxel treated, DT-B – β-interferon treated, NT-Dex – normal treated with 100 mg/kg DEAE-Dextran, NT-PTX – normal treated with 30 mg/kg paclitaxel and NT-B – normal treated with β-interferon.

