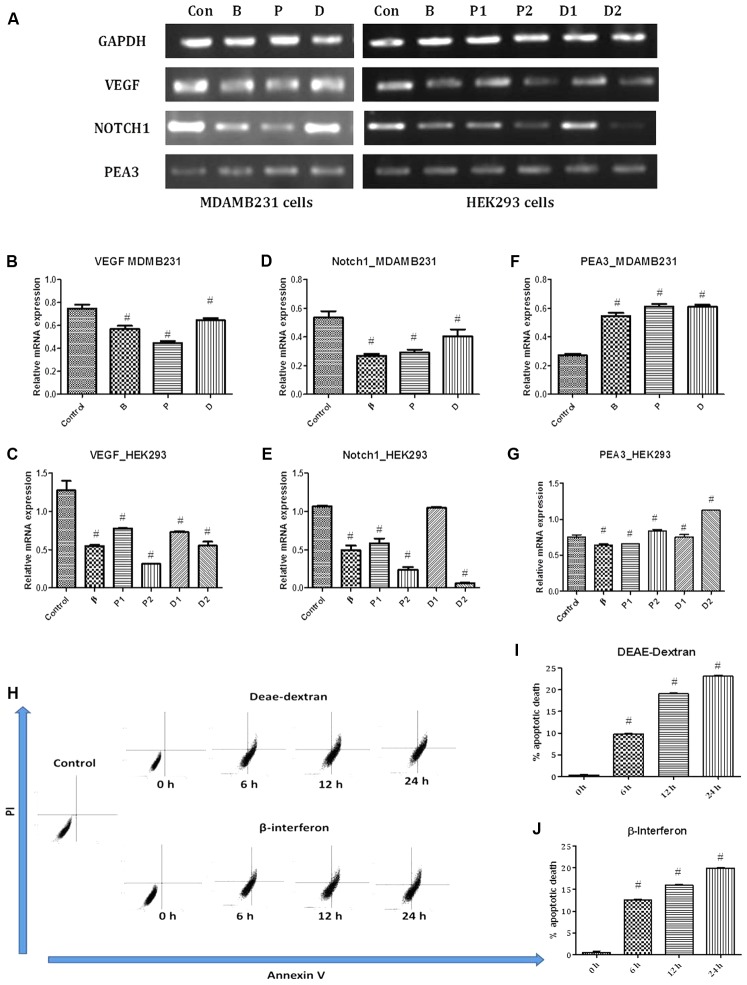
FIGURE 5.
(A) PCR bands in various treated cells. Con – vehicle control cells, B – β-interferon treated cells, P1 – 1 μM paclitaxel treated cells, P2 – 5 μM paclitaxel treated cells, D1 – 1 μM DEAE-Dextran treated cells, and D2 – 5 μM DEAE-Dextran treated cells. (B) VEGF gene expression study in MDA-MB-231 cells, (C) VEGF gene expression study in HEK293 cells, (D) NOTCH1 gene expression study in MDA-MB-231 cells, (E) NOTCH1 gene expression study in HEK293 cells, (F) PEA3 gene expression study in MDA-MB-231 cells, and (G) PEA3 gene expression study in HEK293 cells. # Significantly different from control (P < 0.05), Values expressed as Mean ± SEM. Control – untreated HEK293 and MDA-MB-231 cells, P1 and P – 1 μM paclitaxel, P2 – 5 μM paclitaxel, D1 and D – 1 μM DEAE-Dextran, D2 – 5 μM DEAE-Dextran, B and β – β-interferon treated cells. Flow cytometric analysis for determination of apoptosis; (H) FACS analysis data of PI vs Annexin V in various treated samples up to a duration of 24 h, (I) % apoptotic death over-time post-treatment with DEAE-Dextran, and (J) % apoptotic death over-time post-treatment with β-interferon. # Significantly different from control cells (P < 0.05), Values expressed as Mean ± SEM. 0 h – control cells at 0 h treatment with DEAE-Dextran or β-interferon, respectively, 6, 12, 24 h – 6, 12, and 24 h treated cells, respectively.

