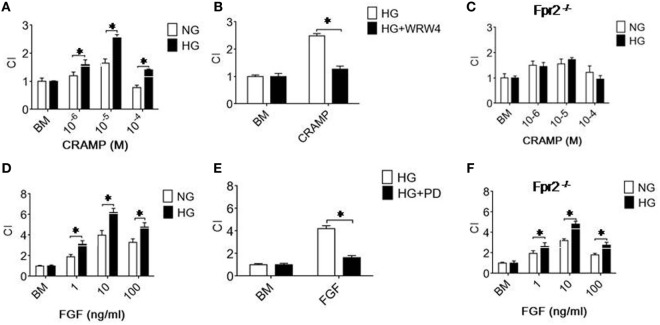
Figure 2.
Formyl peptide receptor 2 (Fpr2)- and fibroblast growth factor receptor 1 (FGFR1)-mediated chemotaxis of Müller glial cells (MGCs). MGC chemotaxis was measured by 48-well chambers. The results are expressed by the chemotaxis index (CI) defining the fold increase in cell response to chemoattractants vs. medium control (BM). (A) Migration of MGCs treated with normal glucose (NG) (5.5 mM glucose) or high glucose (HG) (25.0 mM, glucose) in response to cathelin-related antimicrobial peptide (CRAMP). (B) Inhibition of CRAMP (10−5 M)-induced chemotaxis of MGCs by the Fpr2 antagonist WRW4. (C) Absence of chemotaxis of MGCs from Fpr2−/− (RS2 KO) mice in response to CRAMP. (D) MGC migration in response to b-FGF. (E) Inhibition of b-FGF (10 ng/ml) induced chemotaxis of MGCs cultured in HG by the FGFR antagonist PD 173074 (PD). (F) Chemotaxis of MGCs from Fpr2−/− mice in response to b-FGF. *Indicates significantly (p < 0.05) increased migration of MGCs cultured with HG compared with cells treated with NG. *Indicates significant (p < 0.05) inhibition of CRAMP-induced chemotaxis of HG-cultured MGCs.

