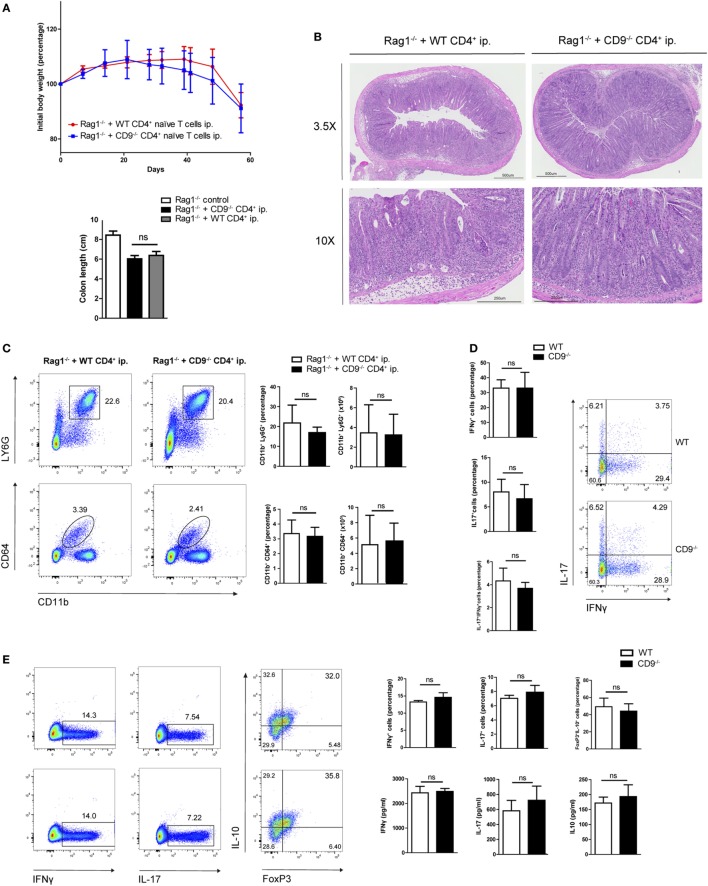
Figure 4.
CD4+ T cell-expressed CD9 does not contribute to adoptive transfer-mediated colitis or T cell differential subset skewing. (A) Top, body weight after intraperitoneal adoptive transfer of CD4+CD45RBhi CD62L+CD25− T cells from WT and CD9−/− donors into Rag1−/− recipients. Bottom, colon length at sacrifice on day 57. Data are from a representative experiment repeated three times with similar results. n = 5–6 mice per group; unpaired t-test. ns, non significant. (B) Representative 3.5× and 10× magnification H&E-stained colonic sections from Rag1−/− mice injected with WT and CD9−/− CD4+ cells, showing transmural infiltration affecting all colon layers in both settings. (C) FACS analysis of myeloid cell infiltration. Representative dot plots are shown on the left; quantification of CD45+-gated cell percentages and total numbers is shown on the right. (D) Flow cytometry analysis of intracellular staining for IFNγ and IL-17 in T cells from the mesenteric lymph nodes (MLNs) of RAG1−/− mice 2 months after CD4+ T cell transfer. Cells were cultured for 72 h on an anti-CD3/CD28-coated plate and brefeldin A was added for the last 4 h. Representative dot plots and bar quantifications are shown of CD4+CD25+-gated cells. n = 5–6 mice per group; unpaired t-test. (E) In vitro T cell differentiation toward Th1, Th17, and Treg CD4+ T cell subsets. Representative dots plots are shown of intracellular IFNγ, IL-17, and IL-10 in sorted populations, with quantification on the right (top row). Cytokine release was quantified by ELISA (bottom). Data are from a representative independent experiment of three performed and are presented as mean ± SD. n = 5 per genotype; unpaired t-test.

