
Figure 4.
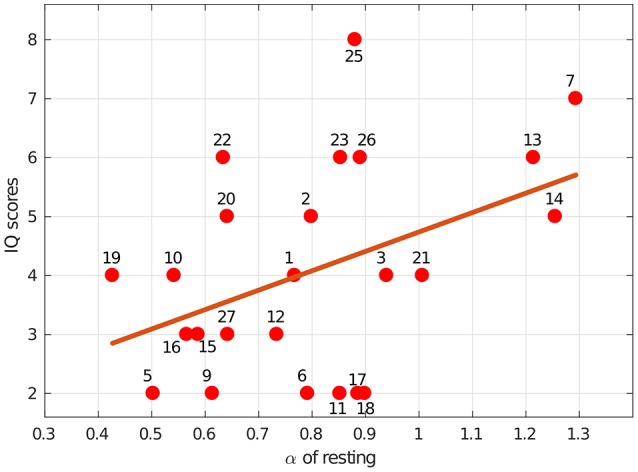
Intelligence, as measured by our IQ-test score, was associated with blink rate variability dynamics. The line indicates the least-squares regression fit [r(22) = 0.43, p = 0.035, R2 = 0.185] for IQ scores vs. the α exponents estimated during the resting session. The numbers indicate specific subjects.