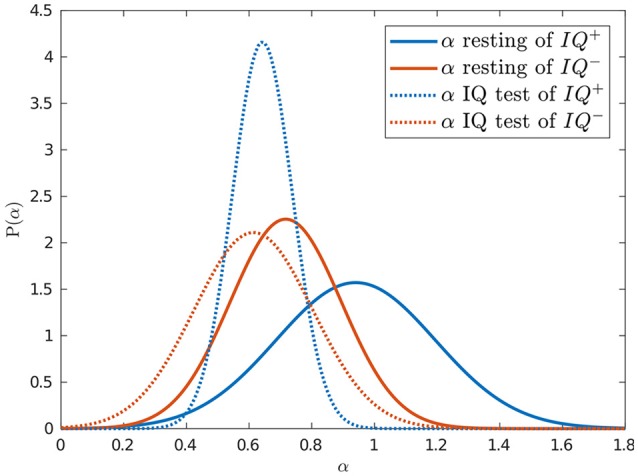
Figure 5.

Intelligence was predicted by blink rate variability dynamics while resting. Normal probability density functions were fitted to the estimated α exponents of the resting (solid) and IQ-test (dotted) sessions for the groups with higher (blue) and lower (red) IQ scores.
