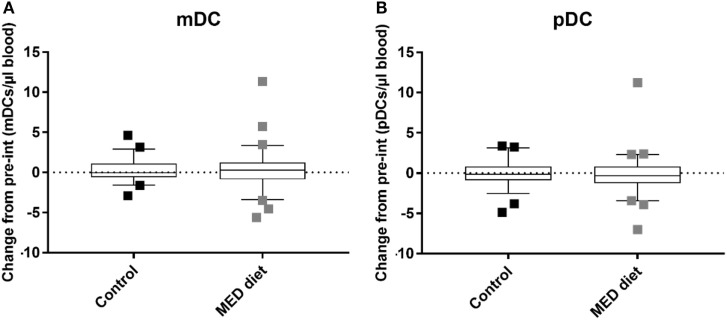
Figure 3.
Myeloid DC (mDC) and plasmacytoid DC (pDC) counts after dietary intervention for control and MED diet study groups. Whole blood from control and dietary intervention groups was stained with anti-CD1c to identify mDCs, CD303 to identify pDCs, and anti-CD14 and CD19 to exclude CD14+ monocytes and CD19+ B cells, of which a high proportion express CD1c. The data show box and whisker plots of change in mDC (A) and pDC (B) counts from pre- to post-intervention in elderly subjects extending from the 25th to the 75th percentiles, with the horizontal line representing the median. Whiskers were determined using Tukey’s method using the 25th and 75th percentile plus 1.5 times the interquartile range (IQR) as the end of the whiskers. Squares represent individual participants where the values fell above the 25th or 75th quartile plus 1.5 times the IQR. A Mann–Whitney U test was used to determine the presence of differences between the control and dietary intervention cohorts. n = 58, Control group, n = 62, Mediterranean (MED)-diet group, significance assumed at *P < 0.05, **P < 0.01, P = 0.9104 (mDCs) and P = 0.3553 (pDCs).

