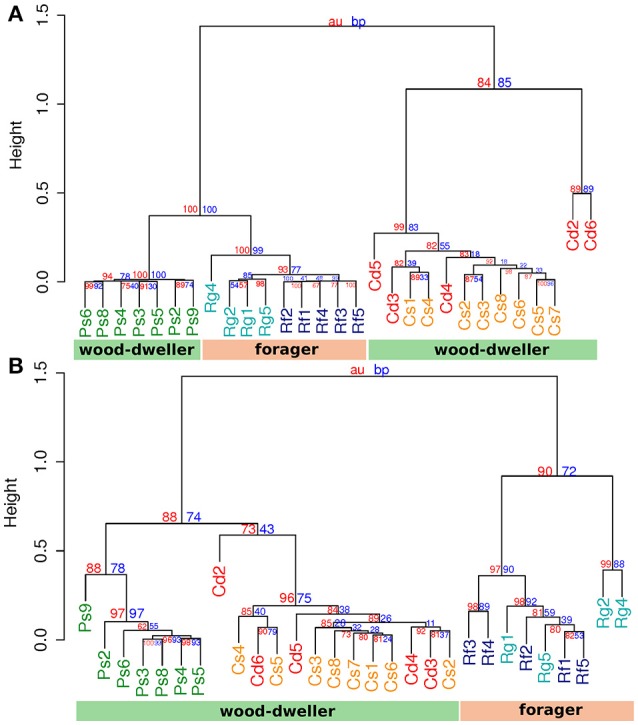
Figure 4.

Cluster analysis by protist and bacterial community distances. (A) Cluster dendrogram based on protist community distances. (B) Cluster dendrogram based on bacterial community distance. Cd, colonies of C. domesticus; Cs, C. secundus; Ps, P. simplex; Rf, R. flavipes; Rg, R. grassei. Blue numbers, bootstrap probability; red numbers, approximate unbiased probability (Suzuki and Shimodaira, 2006). The weighted UniFrac metric was used. Clustering was performed using the UPGMA algorithm.
