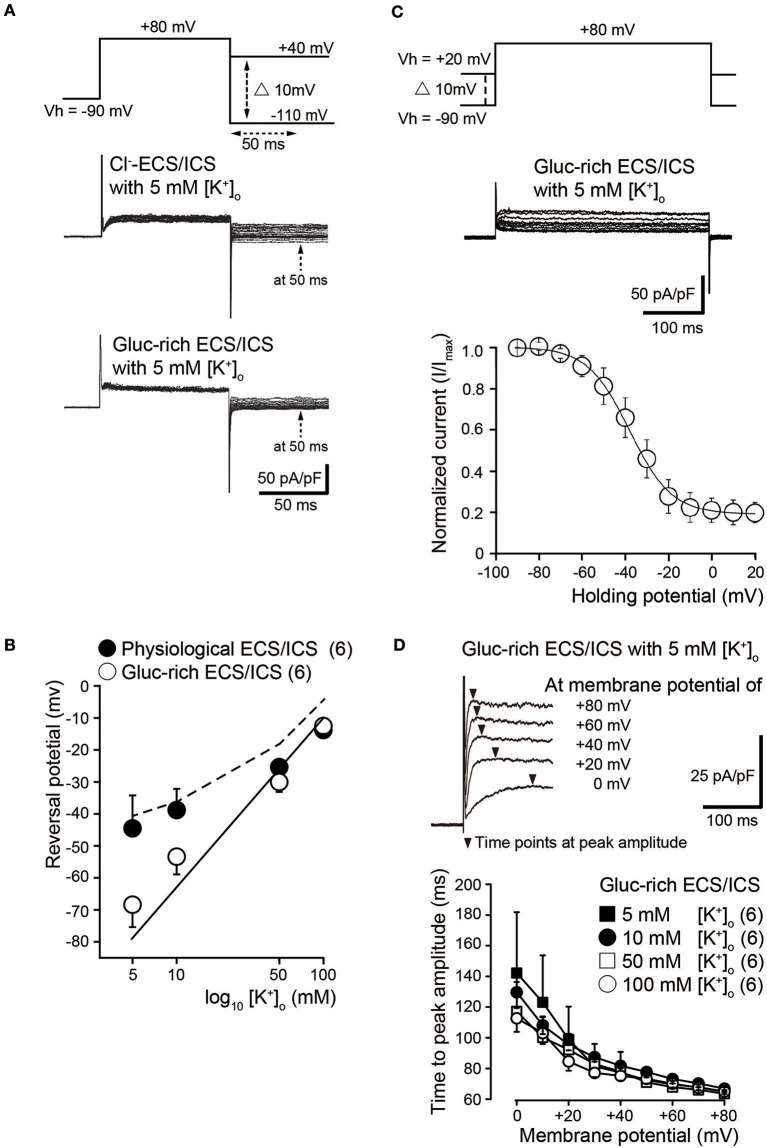
Figure 2.
Biophysical properties of outward currents in odontoblasts. (A) Representative current traces recorded under conditions of Cl−-rich ECS and ICS (middle traces) as well as gluc-rich ECS and ICS (lower traces) are shown. Currents were elicited by voltage steps from a Vh of −70 mV to +80 mV before hyperpolarizing in 10 mV increments ranging from −110 to +40 mV (upper traces). To analyze the values of reversal potential, we measured the amplitudes at 50 ms (dashed arrows in both the middle and lower) after initiating hyperpolarized voltage pulsing (dashed double headed arrow in upper) under both conditions. (B) Semilogarithmic plots of reversal potential against various [K+]o (5–100 mM) under Cl−-rich physiological (filled circles) and gluc-rich (open circles) conditions are shown. The reversal potentials under gluc-rich conditions were closely fitted to expected values, which were estimated for pure K+ conductance described by the Nernst equation (solid line). The dashed line shows the reversal potentials estimated by the Goldman-Hodgkin-Katz equation with a Cl− permeability of 0.19 ± 0.16 (K+ permeability was set to 1.0). Each point indicates the reversal potentials for the mean ± SD from each 6 cell. (C) Representative current traces for steady-state inactivation recorded under gluc-rich ECS and ICS conditions (middle traces) are shown. Currents were evoked by incrementally stepping to a membrane potential of +80 mV from various starting Vh values, which varied from −90 to +20 mV (upper traces). In each recording, Vh was maintained for at least 30 s before applying the depolarizing step. Relationships between normalized peak current amplitudes (I/Imax; see text) under gluc-rich conditions and various applied holding potentials were well fitted to the Boltzman function (Equation 1). (D) Representative current traces in the presence of 5 mM [K+]o recorded under glu-rich ECS and ICS conditions evoked by voltage-steps from 0 to +80 mV in 20 mV increments from a Vh of −70 mV are shown. To analyze activation kinetics, time to peak current amplitudes were measured (time from initiation of voltage pulse to peak current amplitudes; filled triangles) in the presence of 5 mM [K+]o (filled squares), 10 mM [K+]o (filled circles), 50 mM [K+]o (open squares), and 100 mM [K+]o (open circles), and subsequently plotted against membrane potentials. Each point indicates the values for the mean ± SD from each 6 cell.

