
Figure 3.
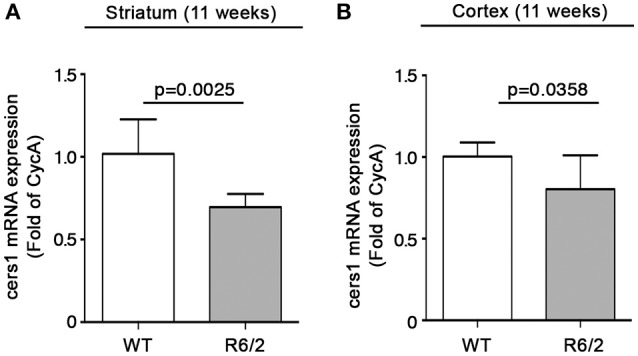
Expression of cers1 is reduced in brain tissues from R6/2 mice. qPCR analysis of cers1 in striatal (A) and cortical (B) tissues from manifest (11-week old) R6/2 mice and wild type littermates. Values are represented as mean ± SD. N = 6–8 for each group of mice. For statistical analyses, Two-tailed Unpaired t-test was used; p < 0.05 were considered significant.