
Figure 5.
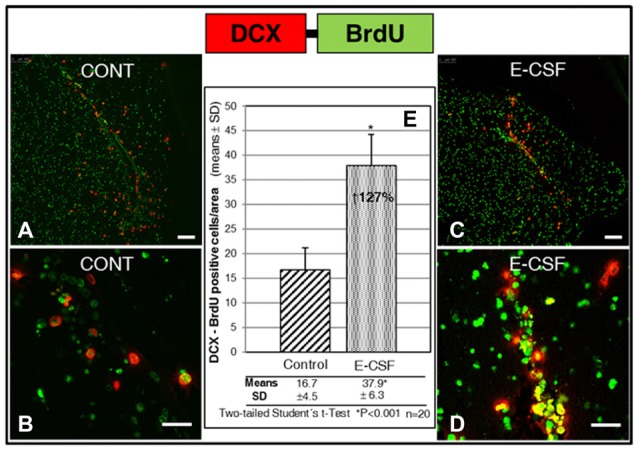
Effect of E-CSF on the number of migratory NSCs, monitored by co-expression of BrdU (green) and Doublecortin (DCX, red). Confocal photomicrographs show the RMS area of “in vitro” cultured adult mice brain slices (RMS in Figure 1B). Quantification of co-labeled BrdU and (DCX) NSCs in Control (A,B) and E-CSF treated brain slices (C,D) was plotted in graph bars (E) and expressed as means ± SD (n = 20); the significant threshold was set at p ≤ 0.001 (*) according to the two-tailed Student’s t-test. The results reveal a significant increase (127%) in the number of RMS migratory NSCs in CSF-E treated brain slices with respect to the controls. Scale bar: 100 μm (A,C) and 25 μm (B,D).