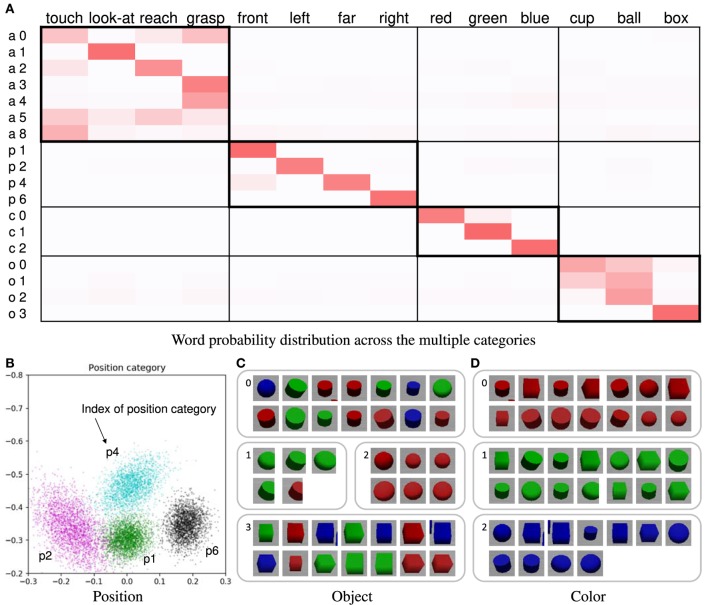
Figure 4.
(A) Word probability distribution across the multiple categories; darker shades represent higher probability values. The pair consisting of a letter and a number on the left of the table is the index of the word distribution, which represents the sensory-channel related to the word distribution and the index of the category. Note that category indices are not shown; they are merged and not used because the number of the categories is automatically estimated by the nonparametric Bayesian method. (B) Learning result of the position category; for example, the index of position category p1 corresponds to the word “front.” The point group of each color represents each Gaussian distribution of the position category. The crosses in the different colors represent the object positions of the learning data. Each color represents a position category. (C) Example of categorization results of object category; (D) example of categorization results of color category.

