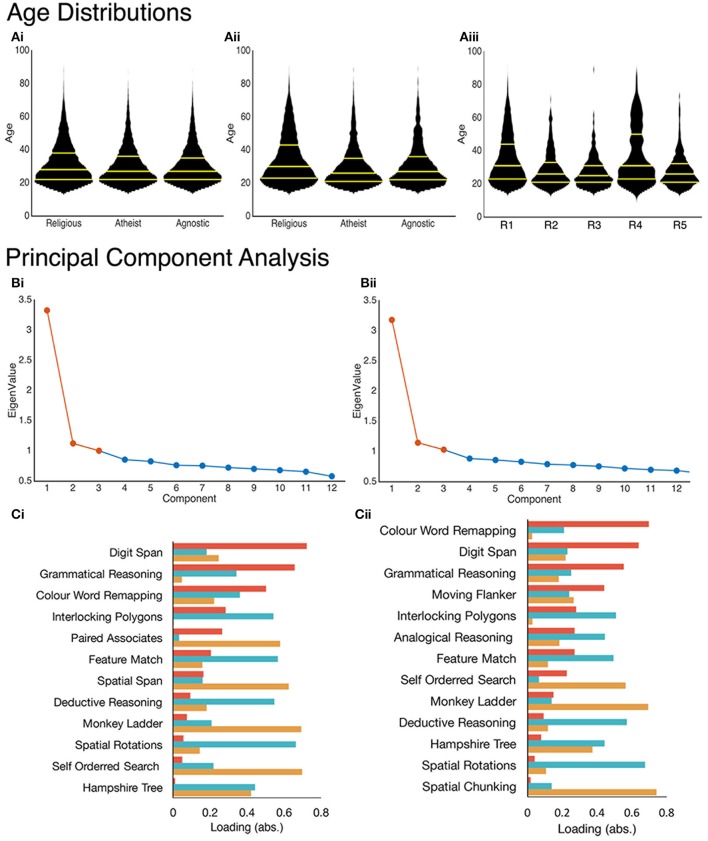
Figure 1.
(A) Age distributions plotted for each group in study 1 (Ai) and for study 2 (Aii,Aiii). Yellow lines indicate the 25, 50, and 75th percentiles within each groups distributions (bottom-to-top). PCA produced 3-component solutions (eigenvalues >1) for both study's. Bi,Bii) Scree plots with those components extracted for calculating individual factor scores highlighted in orange. Ci,Cii) Absolute loadings calculated (Verbal Reasoning = red, Reasoning = blue, Working Memory = orange) using a Varimax rotation plotted for each task (ranked by Verbal Reasoning loading).

