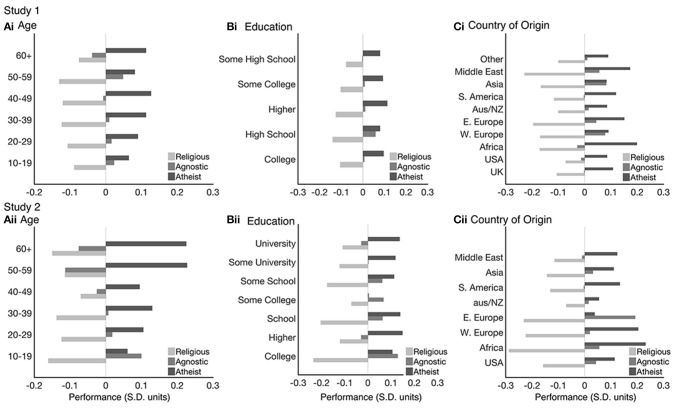
Figure 4.
Religious group effects across the lifespan (Ai,Aii), education (Bi,Bii) and Country of Origin (Ci,Cii) for both study's. These demonstrate how the religiosity effects are not contingent on other sociodemographic variables. Bars represent Overall Mean component score in Standard Deviation units (Mean = 0, SD = 1) for the religious (light gray), agnostic (gray), and Atheist (dark gray) groups.

