
FIGURE 4.
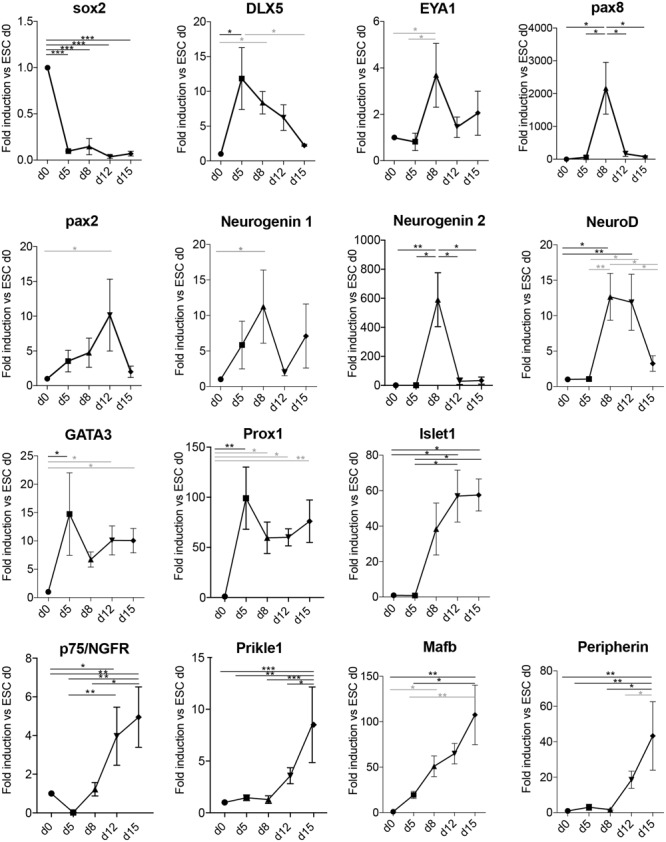
Neuronal differentiation transits through otic developmental steps. Gene expression analysis of the spiral ganglion development-related genes Sox2, Dlx5, Eya1, Pax8, Pax2, Neurogenin 1, Neurogenin 2, NeuroD, GATA3, Prox1, Islet1, p75, Prikle1, Mafb, and Peripherin at the indicated days in culture in differentiation conditions. Values are fold induction versus undifferentiated mESCs (d0, set as 1). For each time point, the average fold induction obtained in three to five independent experiments is shown. d0 (n = 5); d5 (n = 3); d8 (n = 5); d12 (n = 4); and d15 (n = 3). Error bars are SEM. Black (ANOVA with multiple comparison correction, Tukey’s test); Gray bars (ANOVA w/o multiple comparison correction: Fisher’s LSD test). (∗p < 0.05, ∗∗p < 0.01, ∗∗∗p < 0.005).