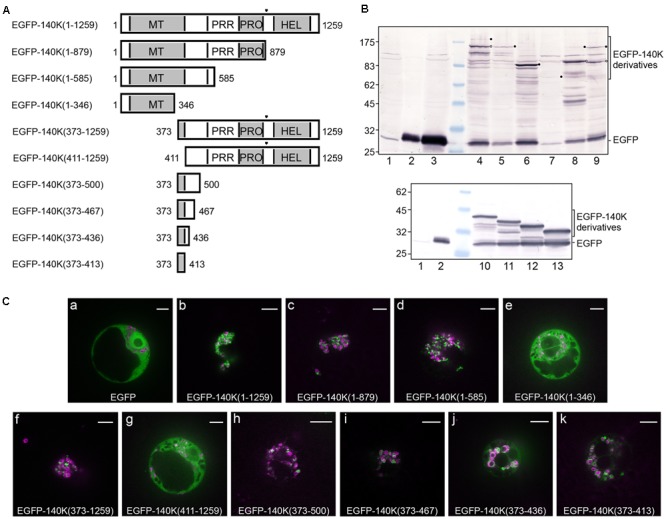
FIGURE 3.

Deletion mapping of the chloroplast targeting domain. (A) Schematic representation of the EGFP-140K derivatives. Protein domains are designated as in Figure 1 and the (PRO↓HEL) cleavage site is represented by a filled triangle. The EGFP moiety present at the N-terminus is not represented. (B) Arabidopsis protoplasts were transfected with water (lane 1) or the expression plasmids pΩ-EGFP (lanes 2 and 3), pΩ-EGFP-140K(1–1259) (lane 4), pΩ-EGFP-140K(1–879) (lane 5), pΩ-EGFP-140K(1–585) (lane 6), pΩ-EGFP-140K(1–346) (lane 7), pΩ-EGFP-140K(373–1259) (lane 8), pΩ-EGFP-140K(411–1259) (lane 9), pΩ-EGFP-140K(373–500) (lane 10), pΩ-EGFP-140K(373–467) (lane 11), pΩ-EGFP-140K(373–436) (lane 12) and pΩ-EGFP-140K(373–413) (lane 13). The cells were harvested 48 h post-transfection (hpt) and equivalent amount of total proteins (except lane 2 which corresponds to 1/10th of the other samples) were subjected to 10% SDS-PAGE and immunoblot analysis with anti-GFP antibodies. Molecular mass markers (Biolabs) are indicated on the left, whereas positions of EGFP-140K derivatives and EGFP are indicated on the right. Filled dots indicate the position of full-length proteins, whereas open dots indicate the position of the mature product after processing at the (PRO↓HEL) cleavage site, when appropriate. (C) Arabidopsis protoplasts were transfected with the expression plasmids as indicated, together with pΩ-RbCS-NiRFP. Single protoplasts were observed by spinning-disk confocal laser microscopy (SPCLM) 48 hpt and EGFP localization was observed (green). To visualize the localization of chloroplasts, NiRFP fluorescence and chlorophyll autofluorescence were acquired (magenta) and superimposed onto the EGFP fluorescence. Scale bars, 10 μm.
