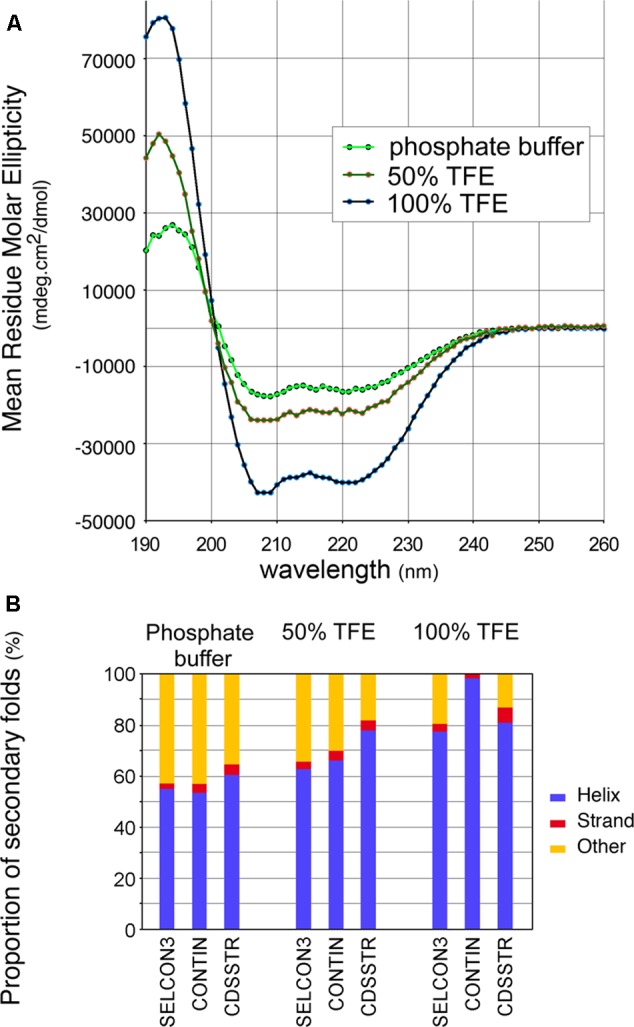
FIGURE 5.

Circular dichroism (CD) spectra of a synthetic peptide confirms the helical conformation of the CTD. (A) CD spectra of a synthetic peptide corresponding to residues 374–410 were recorded in aqueous phosphate buffer, in semihydrophobic (50% TFE), and hydrophobic (100% TFE) environments. Each spectrum corresponds to the average of 10 acquisitions. (B) Estimated distribution of secondary folds in the synthetic peptide in the different environments assayed, using the deconvolution algorithms SELCON3, CONTIN and CDSSTR from the Dichroweb server (Whitmore and Wallace, 2008).
