
FIGURE 1.
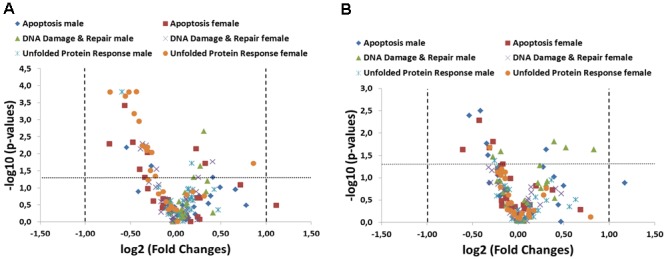
Summary of targeted pathway analysis by RT-qPCR arrays including 79 specific transcripts. A volcano plot analysis of gene expression differences between the 33% GM maize and 33% near-isogenic control maize group is plotted on the x-axis (log2 scale), and the statistical significance (p < 0.05) is plotted on the y-axis (–log10 scale) both in ileum (A) and colon (B). The dotted lines indicate fold-changes higher or lower than a twofold up- or down-regulation (values right and left of the vertical lines, respectively) as well as statistical significance (values above the horizontal line).