
FIGURE 4.
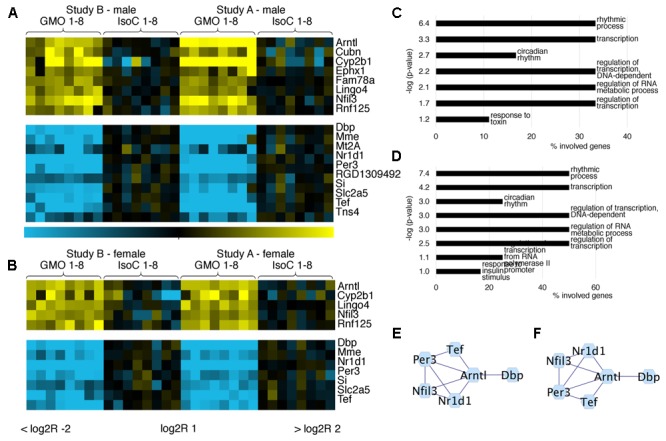
Comparative analysis of commonly differentially expressed genes in both feeding trials. Heatmaps showing the top differentially expressed genes with more than twofold up/down-regulation (q < 0.05) in ileum of male (A) and female (B) rats fed near-isogenic or GM maize. GO analysis of differentially expressed genes (log2R > 1 or < –1) in males (C) or females (D) indicates pathways with significantly regulated genes. Networks of protein-protein interactions in males (E) or females (F) showing associations in sets of differentially expressed genes.