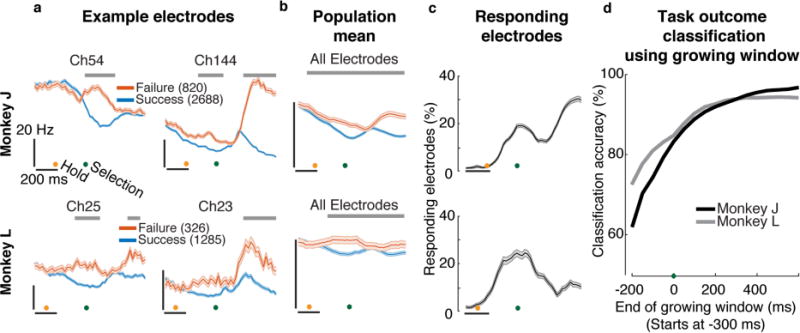
Figure 2. Decoding trial outcome-dependent neural differences.

Green dot corresponds to t=0 target selection time, as in figure 1. Orange dot shows target hold start. (a) Trial-averaged firing rates (mean±s.e.) of example electrodes during failed (red) and successful (blue) trials. Gray bars indicate times with significance differences (t-test with Bonferroni correction, p<0.05, Methods). (b) Population trial-averaged firing rates. (c) Percentage of electrodes that show significant differences as a function of time (mean±s.e.). (d) Offline single-trial outcome decoding accuracy as a function of the end of a growing decoded time window, which starts at 300 ms before selection and ended between 200 ms before until 600 ms after target selection. The dataset in panels c and d combine six (J: 12,648 trials) and four (L: 5,528 trials) days of closed-loop BMI experiments.
