
Figure 4. Information related to error direction is present in and can be decoded from motor cortical activity.
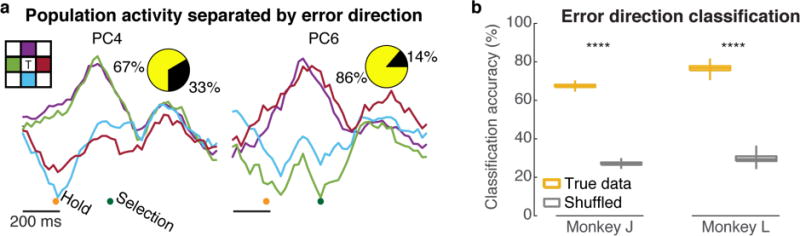
(a) Neural responses exhibited distinct patterns depending on which of the four targets adjacent to the cued target (shown in the colored insert) was incorrectly selected. Here we show monkey J’s neural activity (see Supplementary figure 9 for monkey L) projected onto two neural dimensions (using ‘direction-targeting’ PCA) and were chosen because their variance is mostly explained by the differences between direction conditions. Pie charts show relative variance contribution of the averaged-across-directions error signal (black) and the separated-by-direction error signal (yellow). (b) Classification accuracy when predicting which of the four targets adjacent to the cued target the monkey erroneously selected using neural data from 300 ms before until 600 ms after selection time. To determine chance classification, we decoded data with randomly shuffled error direction labels.