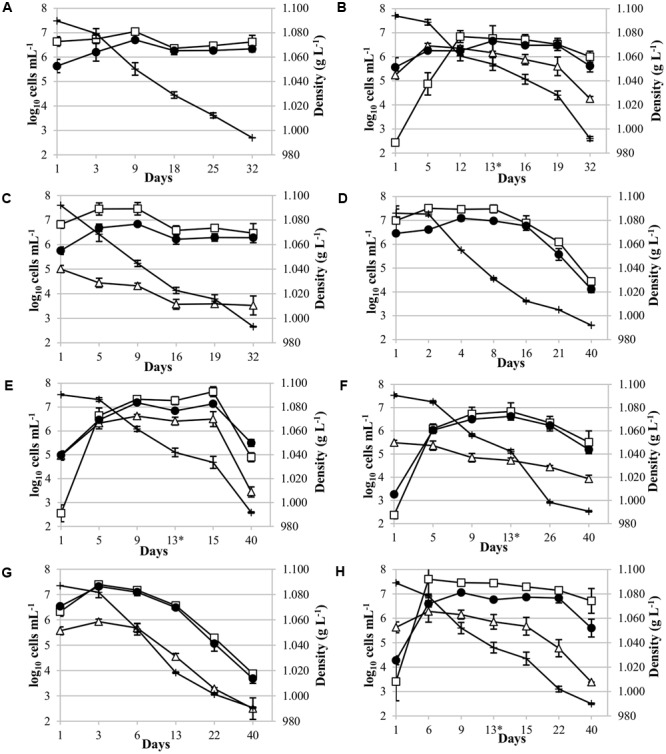
FIGURE 2.

Yeast population dynamics during Malvar fermentation. Results, expressed as log10 cells mL-1, were obtained using YPD culture media (●) and qPCR analysis [(□) for Saccharomyces cerevisiae; (∆) for non-Saccharomyces strains] and, density values (+) expressed in g L-1. Species population analyzed: (A) Pure culture of S. cerevisiae CLI 889, control p-ScI; (B) sequential culture of T. delbrueckii CLI 918 and S. cerevisiae CLI 889 (s-Td/ScI); (C) mixed culture of Metschnikowia pulcherrima CLI 457 and S. cerevisiae CLI 889 (m-Mp/ScI); (D) pure culture of S. cerevisiae, control p-ScII; (E) sequential culture of Schizosaccharomyces pombe CLI 1079 and S. cerevisiae CLI 889 (s-Sp/ScII); (F) sequential culture of Candida stellata CLI 920 and S. cerevisiae CLI 889 (s-Cs/ScII); (G) mixed culture of Lachancea thermotolerans 9-6C and S. cerevisiae CLI 889 (m-Lt/ScII); and (H) sequential culture of L. thermotolerans 9-6C and S. cerevisiae CLI 889 (s-Lt/ScII). Asterisk in graphics indicates the day of inoculation of S. cerevisiae strain in sequential cultures.
