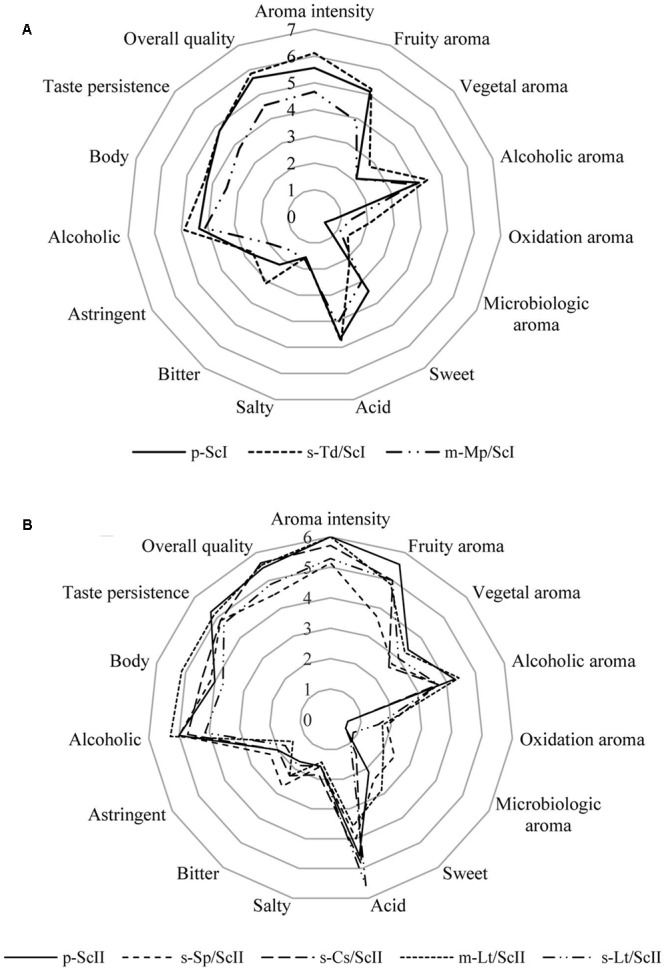
FIGURE 4.

Cobweb diagrams of mean sensory scores of wines made with Saccharomyces and non-Saccharomyces combinations. (A) Cobweb graph of wines: p-ScI, s-Td/ScI, and m-Mp/ScI; and (B) cobweb graph of wines: p-ScII, s-Sp/ScII, s-Cs/ScII, m-Lt/ScII, and s-Lt/ScII. Abbreviations related with the type of culture employed and the yeast strains are explained in Figure 2.
