
Figure 1.
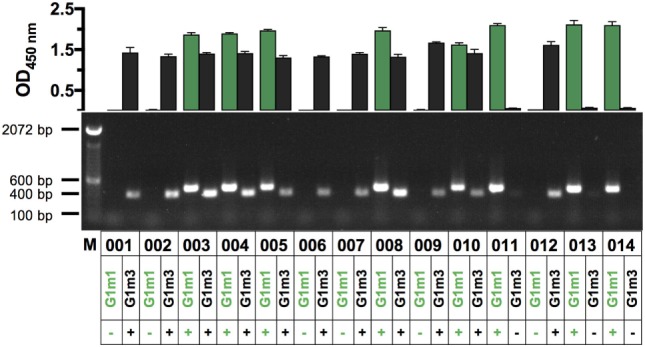
Assessment of IgG1-allotypes G1m3 and G1m1 in a cohort of HIV vaccine recipients via PCR and ELISA (n = 14). In the top chart OD-values for G1m3-specific signals (black bars) and G1m1-specific signals (green bars) are shown for X001 study participants (labeled 001–014). Shown are the mean (±SD) OD450-values of technical triplicates, representative of three replicates. OD-values greater than 0.5 were considered to be positive for the respective IgG1-allotype G1m3 and/or G1m1. The bottom panel shows the corresponding results from a novel PCR protocol, which was used to determine IgG1-allotypes from human RNA. Band sizes are 400 bp for G1m3 and 463 bp for G1m1 as indicated by the marker on the left.