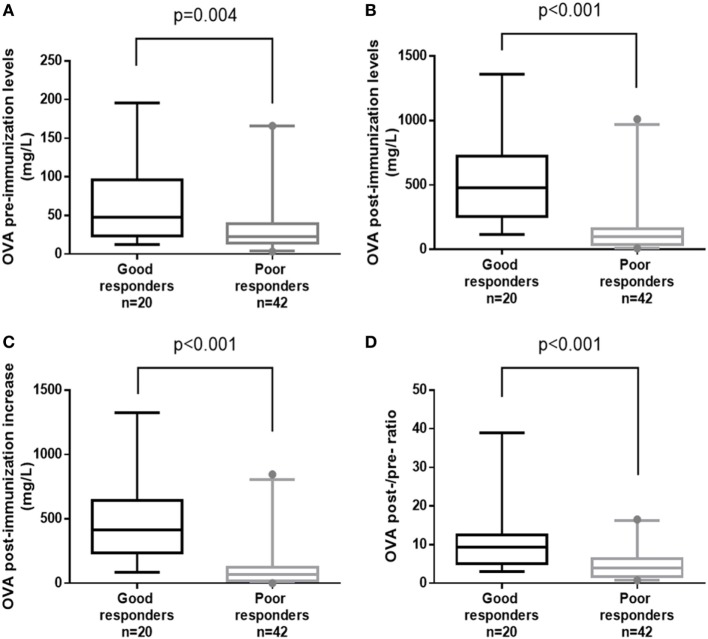
Figure 1.
Box-plot representations of overall assay (OVA) antibody titers for good responders vs. poor responders, using the four indicated parameters: (A) OVA pre-immunization levels, (B) OVA post-immunization levels, (C) OVA post-immunization increase, and (D) OVA post-/pre-ratio. p-Values were calculated in a Mann–Whitney test. Boxes represent the median (50th percentile) and the 25th and 75th percentiles. Whiskers represent the 5th and 95th percentiles, and points are used to indicate extreme values.

