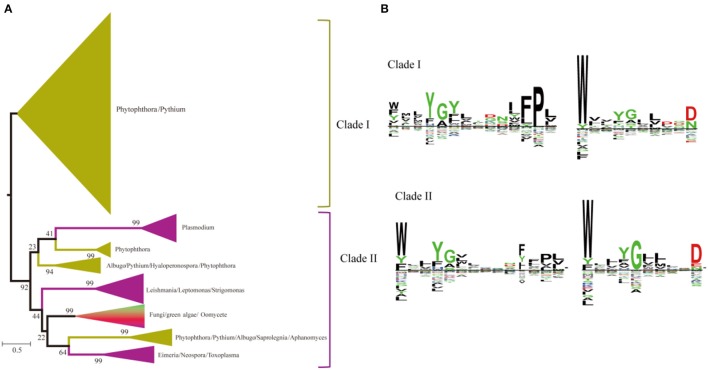
Figure 6.
Phylogenetic and conserved motif analyses of SWEETs from unicellular eukaryotes and fungi. (A) Molecular phylogenetic analysis by the maximum likelihood method. The tree with the highest log likelihood (−116121.8598) is shown. The tree is drawn to scale, with branch lengths indicating the number of substitutions per site. Evolutionary analyses were conducted in MEGA7. (B) Sequence alignment of conserved motifs of SWEETs in different clades corresponding to (A). The sequences were aligned by ClustalW. The conservation level of each residue is indicated by the height of the bar above it. The sequence logo was generated using Seq2Logo.

