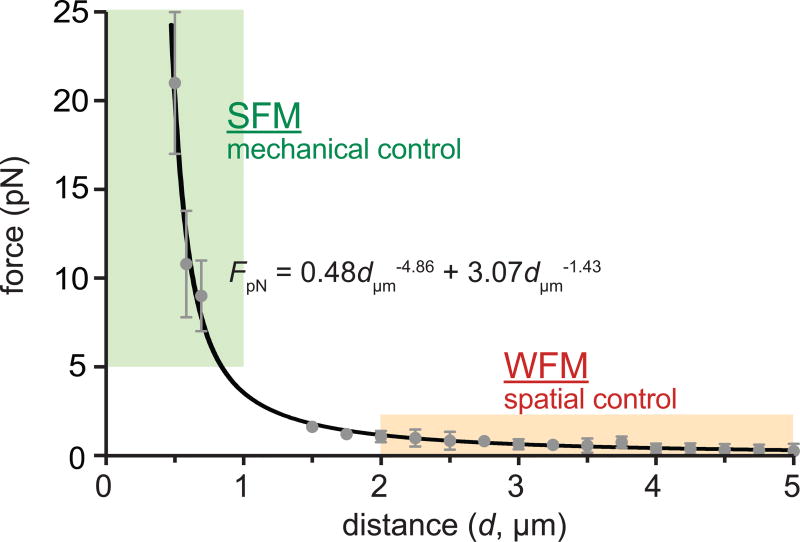
Figure 7. Distance dependent force generation of MPNs.
Force acting on particles was plotted (gray dots) and was fitted with a power law (black solid line). TGT DNA force sensor and Stokes’ drag force are used to measure the applied force at SFM and WFM, respectively Each data point represents the mean value of multiple repetitions (n= 10 for SFM, n=30 for WFM). Error bars represent ±s.d.

