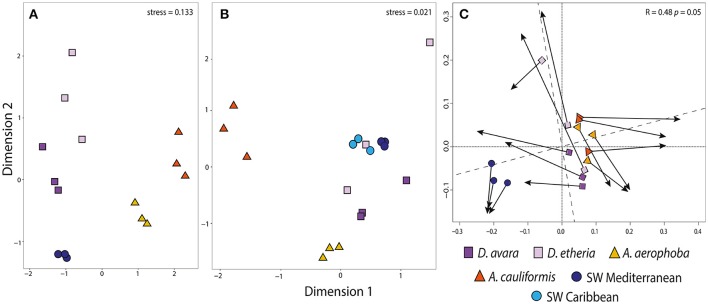
Figure 1.
Community structure in prokaryotic communities among all sampled habitats. Ordination showing the first two axes of the NMDS analysis for (A) bacterial OTU composition; (B) archaeal OTU composition and (C) Procrustes analysis comparing bacterial (A) and archaeal (B) OTU composition. In Procrustes analysis, the arrows point to the target configuration (bacterial OTU composition), the symbols represent the rotated configuration (archaeal composition). Correlation (Corr: 0.48) and significance values (P 0.05) were calculated using the protest function from the vegan R package. Sample groups correspond to Aplysina aerophoba, A. cauliformis, Dysidea avara, D. etheria and Mediterranean and Caribbean seawater. Colors for each sample group are specified in the color legend.

