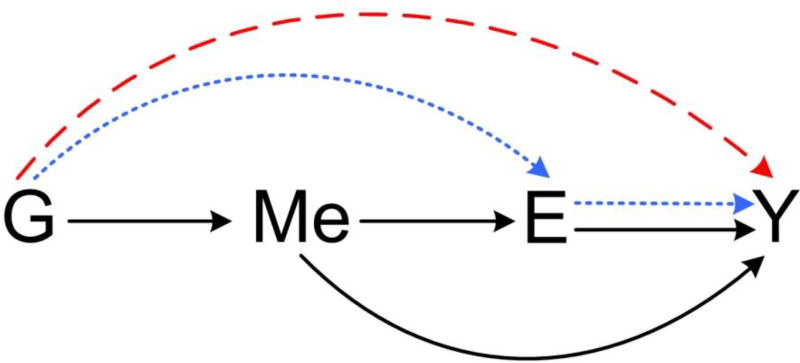
Figure 3. Causal diagram of SNP (G), DNA methylation (Me), gene expression (E), and disease outcome (Y).
Three path-specific effects are 1) Direct effect of SNPs on outcome (dashed red line), 2). Indirect effect of SNP mediated through gene expression but not through methylation (dotted blue lines), and 3). Indirect effect of SNP mediated through methylation (solid black lines).

