Figure 5.
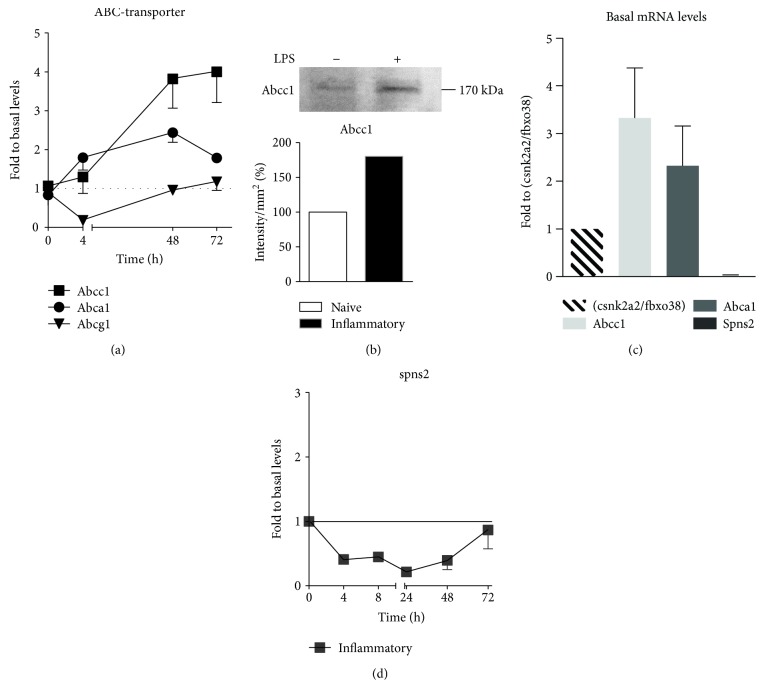
(a) Quantitative real-time PCR for abcc1, abca1, and abcg1 in LPS-stimulated dendritic cells over time normalized to the sum of csnk2a2 and fbxo38 mRNA levels. Levels at time point 0 were set to 1 for each mRNA (n = 4). (b) Western blot stained with anti-Abcc1 antibody of whole-cell lysates of naïve dendritic cells or 48 h upon LPS stimulation. Quantification of Western blot bands (n = 1). (c) Quantitative real-time PCR for abcc1, abca1, and spns2 in untreated dendritic cells (n = 4). Displayed are absolute levels normalized to the sum of csnk2a2 and fbxo38 mRNA levels. (d) Quantitative real-time PCR for spns2 in LPS-stimulated dendritic cells over time normalized to the sum of csnk2a2 and fbxo38 mRNA levels. Levels at time point 0 were set to 1 (n = 4). Data represent mean ± SD.

