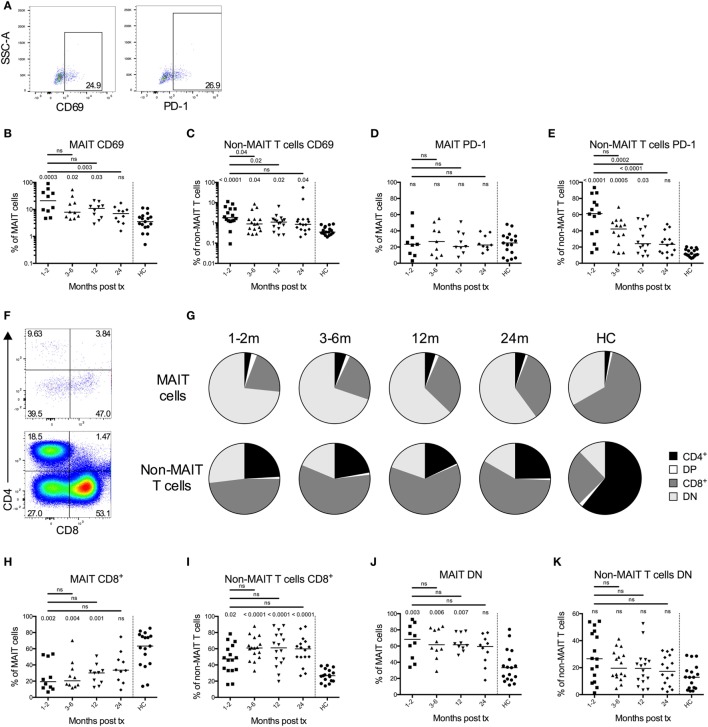
Figure 2.
Mucosal-associated invariant T (MAIT) cells display an activated phenotype and altered CD4 and CD8 expression profile after hematopoietic stem cell transplantation (HSCT). (A) Representative flow cytometry plots from one patient sample showing the gating strategies for CD69 (left) and PD-1 (right) on MAIT cells. (B) CD69 expression on MAIT cells (n = 10) and (C) CD3+CD161dim/negTCRVα7.2dim/neg cells (non-MAIT T cells) (n = 16) examined at several time points after HSCT. (D) PD-1 expression on MAIT cells (n = 9) and (E) non-MAIT T cells (n = 14). Data from healthy controls (HC) are shown to the right of the dotted line [(B–E), n = 17]. (F) Representative flow cytometry plots showing the CD4 and CD8 gating strategies of MAIT cells and non-MAIT T cells. (G) Pie charts with the median proportion of CD4+CD8– (CD4), CD4+CD8+ (double positive, DP), CD4–CD8+ (CD8) and CD4−CD8− (double negative, DN) MAIT cells (top, n = 10), and non-MAIT T cells (bottom, n = 16) at four time points after HSCT and in HC (n = 17). Proportion of (H) CD8+ MAIT cells (n = 10) and (I) CD8+ non-MAIT T cells (n = 16) at four time points after HSCT. Proportion of (J) DN MAIT cells (n = 10) and (K) DN non-MAIT T cells (n = 16) at four time points after HSCT. Data from HC are shown to the right of the dotted line [(H–K), n = 17]. Horizontal lines indicate the median value. Comparisons were made using the Friedman test followed by Dunn’s post-test between the four time points after HSCT. The Kruskal–Wallis test followed by Dunn’s post-test was used to compare patients with controls. In (B,C,H–K), numbers without bars above data points indicate p-values compared to HC.

