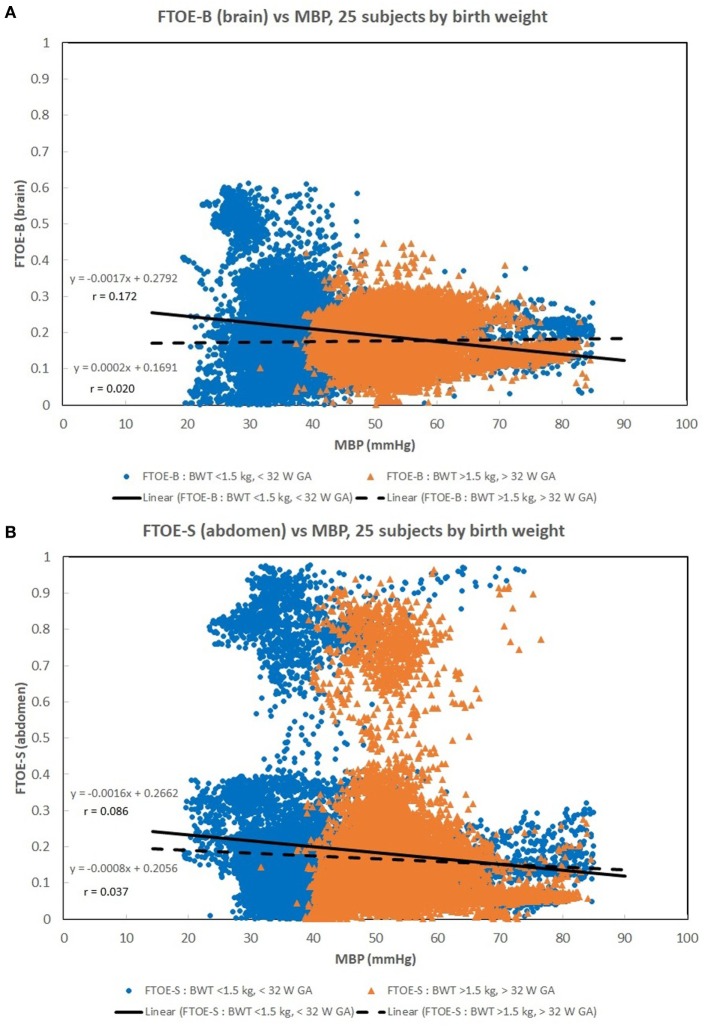
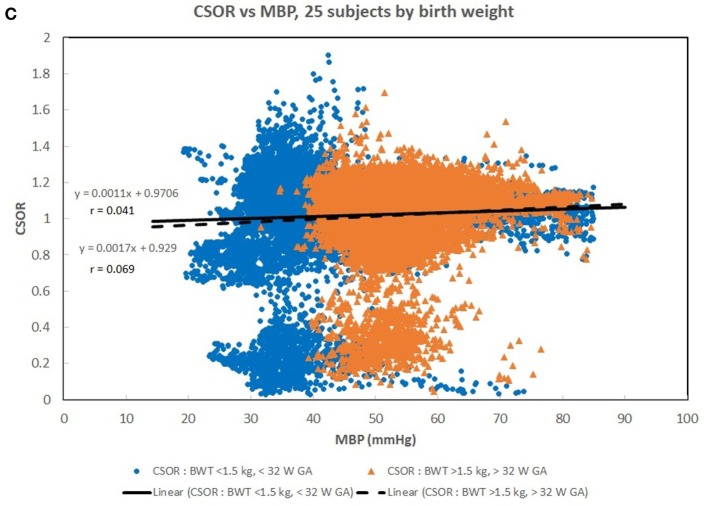
Figure 2.
(A–C) Scatter plots of the oxygenation indices [brain fractional tissue oxygen extraction (FTOE-B), somatic fractional tissue oxygen extraction (FTOE-S), and CSOR] vs mean blood pressure (MBP) with subjects divided into low birth weight (LBW) and moderate birth weight (MBW) groups like that of Figure 1. The LBW group showed a higher linear regression negative correlation (r) to FTOE-B and FTOE-S, where the strongest correlation was with FTOE-B. CSOR weakly correlated to MBP, with little differences between LBW and MBW groups. There were 28,000–31,000 valid (60 s binned) paired data points to create these scatter plots.


