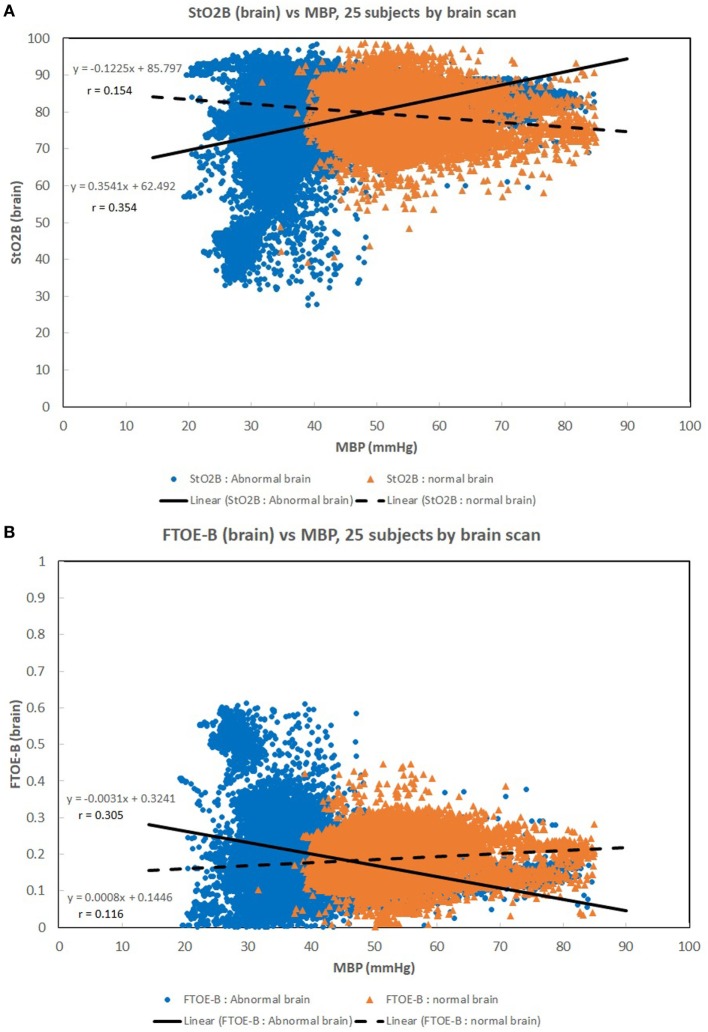
Figure 3.
(A,B) Scatter plots of brain specific tissue oxygen saturation (StO2B) and brain fractional tissue oxygen extraction (FTOE-B) vs mean blood pressure (MBP) with subjects grouped by brain scan results: normal brain (n = 10) and abnormal brain (n = 15). Both the linear regression slopes and correlation (r) values were greater than the previous low birth weight (LBW) group for StO2B and FTOE-B vs MBP of the previous figures. Note that 11 of 15 subjects with brain abnormalities were in the LBW group.

