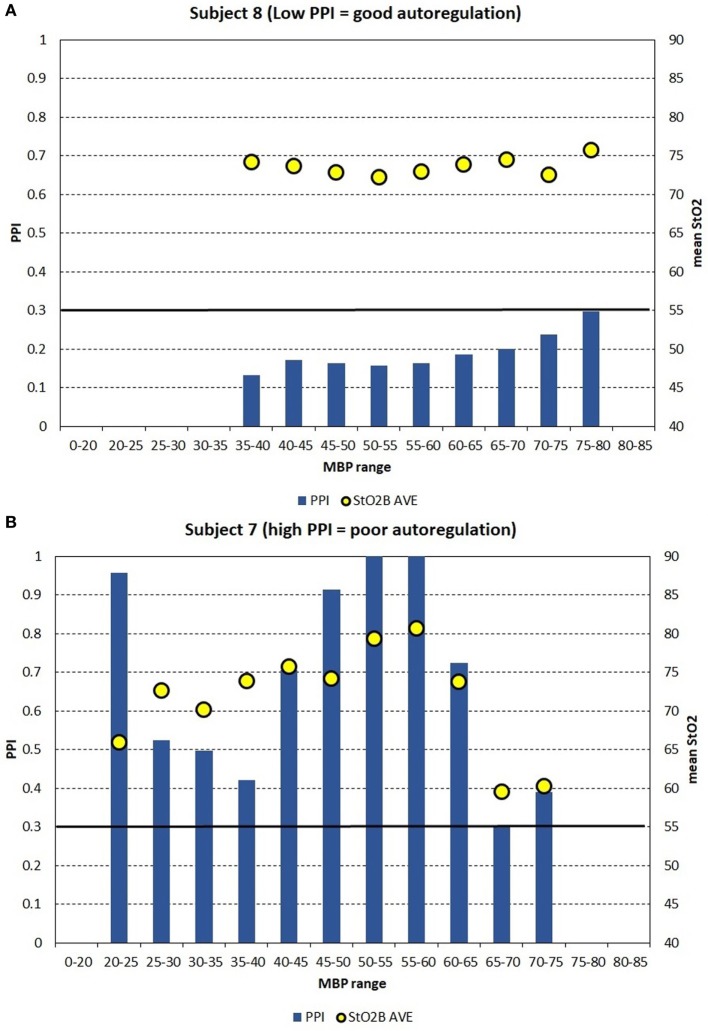
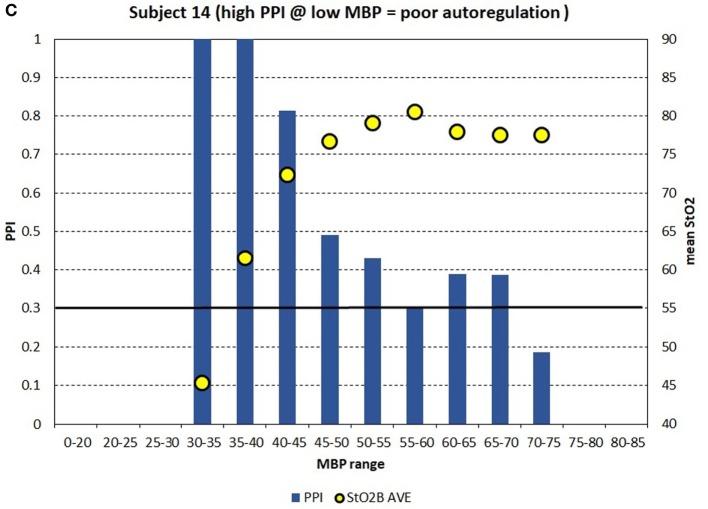
Figure 4.
(A–C) For case study demonstration purposes, the pressure passive index (PPI) is binned into discrete mean blood pressure (MBP) ranges to create PPI profile plots for three subjects, which can be interpretable to autoregulation function. (A) Shows subject data where PPI is low for the MBP ranges measured, where it is believed that autoregulation function is good. (B) Shows subject data where PPI is generally high for the MBP ranges measured, where it is believed that autoregulation function is poor. (C) Shows subject data where PPI is high for low MBP, and PPI is moderate for higher MBP, where it is believed that autoregulation function is poor for low MBP and moderate for higher MBP. The arbitrary black line at PPI = 0.30 is hypothesized to be a transition point where autoregulation function transits gradually from poor to good.


