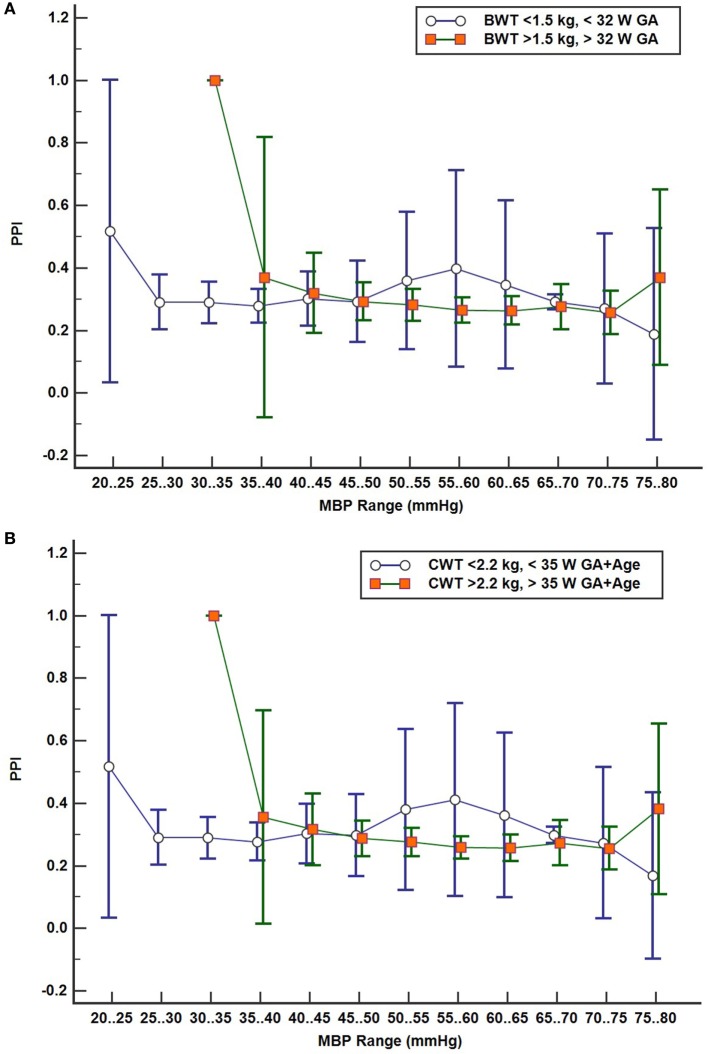
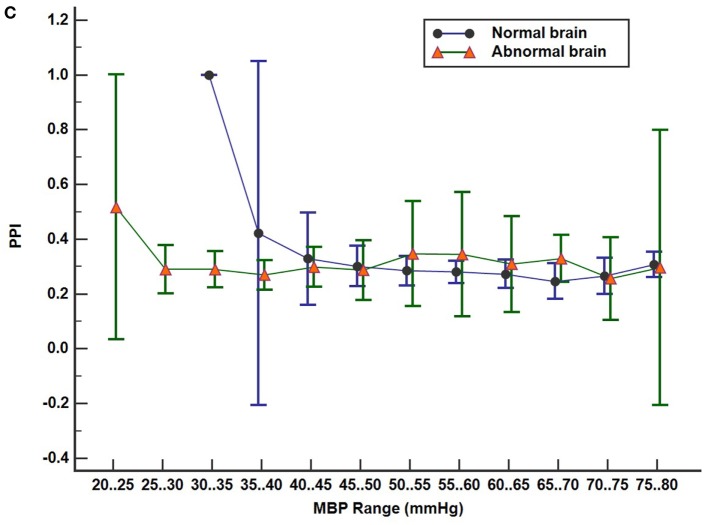
Figure 5.
(A–C) Pressure passive index (PPI) profile plots with subject values binned in discrete mean blood pressure (MBP) ranges by two groups with 95% confidence interval for mean values: (A) by birth weight/gestational age (GA) groups low birth weight (n = 13) vs moderate birth weight (n = 12), (B) by current weight and total age groups LCW (n = 12) and MCW (n = 13), and (C) brain scan results, normal (n = 10) and abnormal brain (n = 15).


