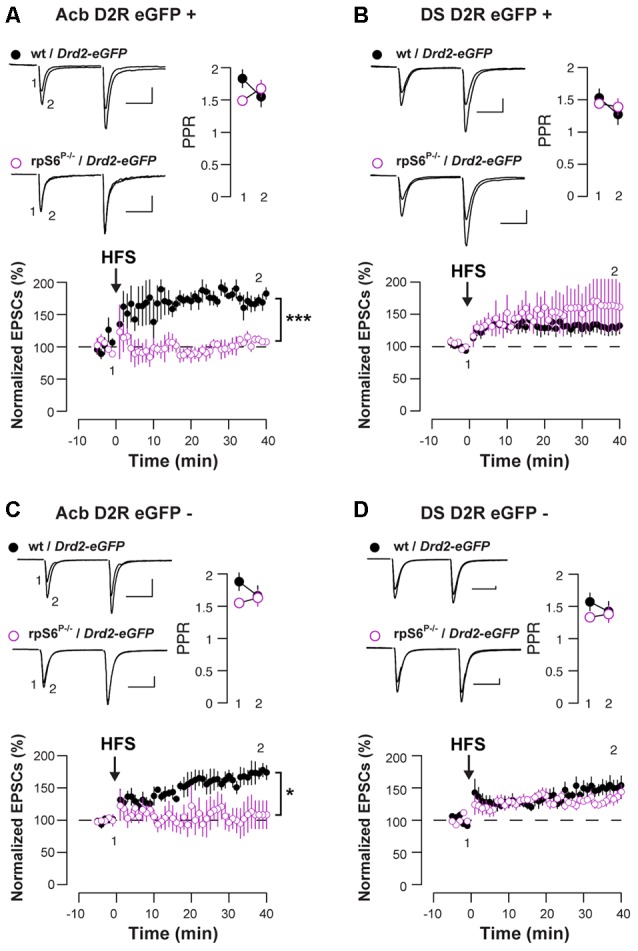
Figure 3.

Altered HFS-induced long-term potentiation (LTP) in Acb D1-and D2-MSNs of rpS6P−/− mice. EPSCs were recorded from eGFP positive (D2-MSNs) (A,B) and eGFP negative (D1-MSNs) (C,D) in the Acb (A,C) or in the DS (B,D) of wt/Drd2-eGFP (black circles) and rpS6P−/−/Drd2-eGFP (magenta open circles) double transgenic mice before and after HFS-induced LTP. Graphs show normalized EPSCs as a function of time and the overlay of averaged (20 trials) traces of AMPAR EPSCs before (1) and after (2) HFS. Scale bars: 50 pA, 20 ms. Symbols represent average of six trials. *p < 0.05; ***p < 0.001 by Student’s t-test (n and p values in Supplementary Table S1:3a–d).
