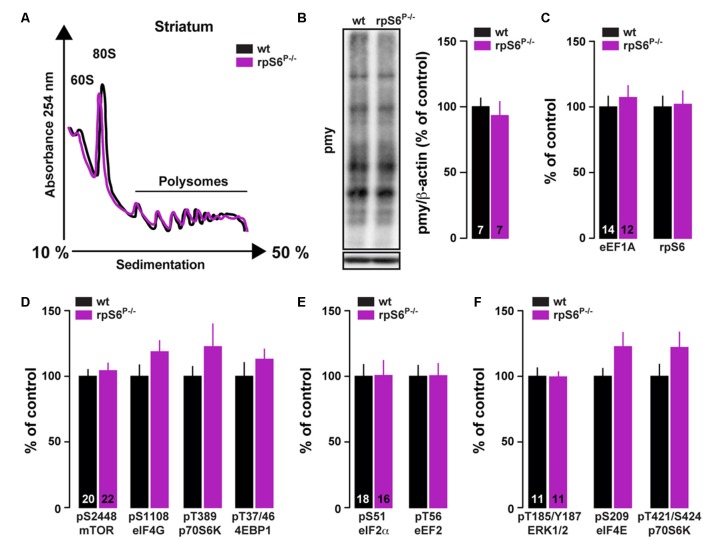
Figure 4.
Analysis of global mRNA translation in the striatum of rpS6P−/− mice. (A) Representative polysome profile of whole striatum lysates from wt (black line) and rpS6P−/− (magenta line) mice (n = 6 mice/group). (B) Representative (left) and quantified (right) western blot analysis of puromycin staining (pmy, normalized to β-actin) in whole striatal lysates from wt (black bars) and rpS6P−/− (magenta bars) mice incubated 10 min with puromycin. Results are represented as means ± SEM (n and p values in Supplementary Table S1:4b). (C–F) Quantified western blot analysis of eE1A and rpS6 (C), pS2448-mTOR, pS1108-eIF4G, pT389-p70S6K and pT37/46-4EBP1 (D), pS51-eIF2α and pT56-eEF2 (E), pT185/Y187-ERK1/2, pS209-eIF4E and pT421/S424-pS70S6K (F) in total striatal lysates from wt (black bars) and rpS6P−/− (magenta bars) mice. The number of animals in each condition is indicated in the bars. Results are represented as means ± SEM (n and p values in Supplementary Table S1:4c–f).

