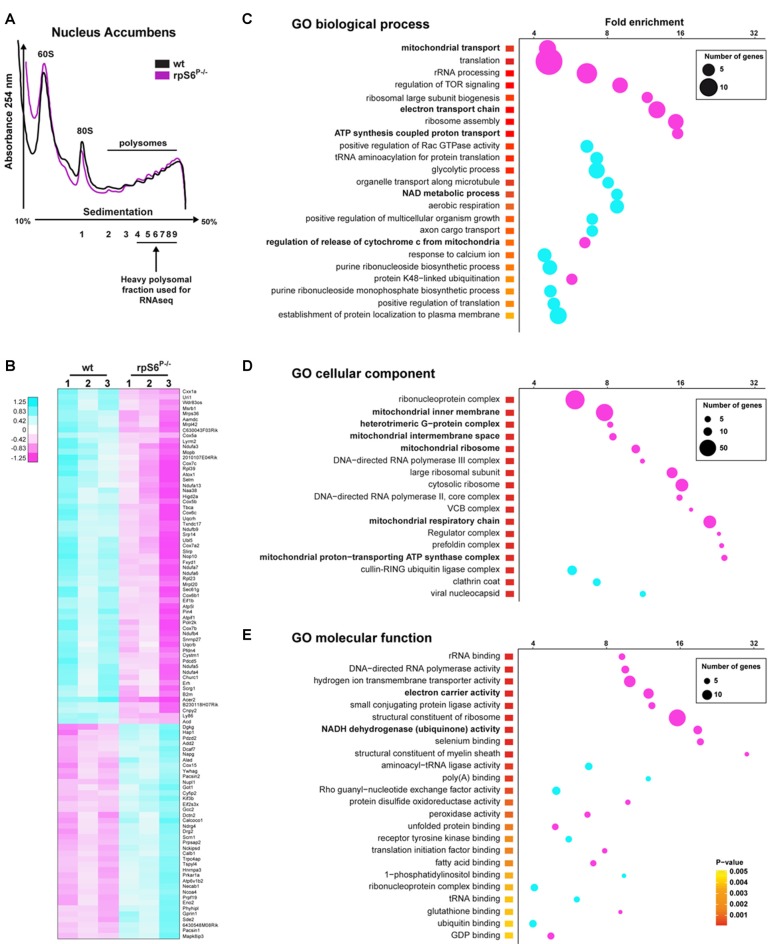
Figure 5.
Altered translation status of a subset of mRNAs in the Acb of rpS6P−/− mice. (A) Representative polysome profile of Acb lysates from wt (black line) and rpS6P−/− (magenta line) mice (top) and schematic representation of the polysomal fractions analyzed by RNAseq (bottom). (B) Heatmap of the top 100 genes most significantly dysregulated by RNAseq between Acb polysomal fractions of rpS6P−/− mice and wt littermates (3 replicates/genotype, 6 mice/replicate). Scaled expression values are color-coded according to the legend. (C–E) Enriched terms of Gene Ontology (GO) analyses including biological process (C), cellular component (D), and molecular function (E) of mRNAs whose expression is significantly changed between wt and rpS6P−/− mice in polysomal fractions from Acb extracts. The fold-enrichment (cutoff > 4) is displayed for each GO terms using Fisher’s exact test (see “Materials and Methods” section). The size of the dots is proportional to the number of genes associated with a given GO term.

