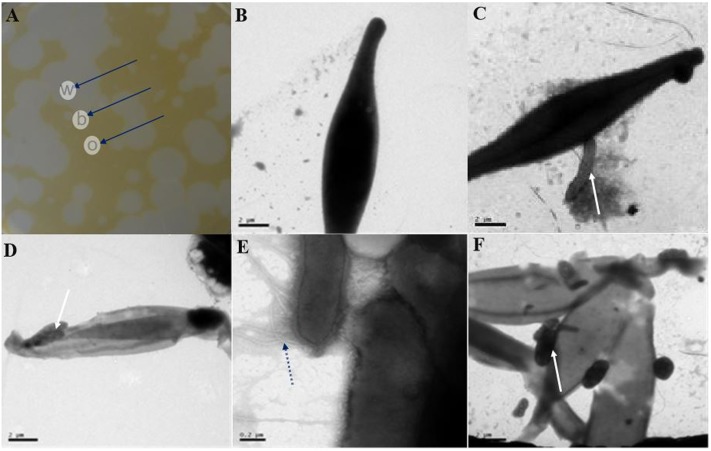
FIGURE 4.
Transmission electron microscopy (TEM) images of the morphological changes of P. tricornutum cells from within, on the boundary and outside of the plaques. (A) Different plaques zone on an algal agar plate. (B) TEM images of outer plaque regions. (C,D) TEM images from the plaque boundaries. (E,F) TEM images from within the plaques. w, within; b, boundary; o, outer plaque regions. Scale bars: (B–D,F) 2 μm and (E) 0.2 μm. Black arrows in (A) indicate the different parts of the plaques, and white arrows in (C,D,F) indicate the site where the bacterial cells contacted the algal cells, while the black dotted arrow in (E) indicates the microtubule structure of a bacterium.

