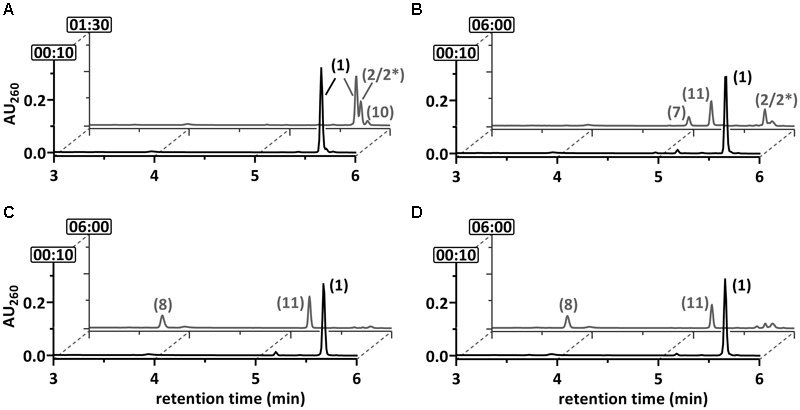
FIGURE 4.

Ultraperformance liquid chromatography diagrams demonstrating the time-dependent conversion of 2-F-BzCoA (1) by (A) BCR, (B) BCR+DCH, (C) BCR+DCH+OAH and (D) BCR+OAH. UPLC analyses of samples are shown, that were taken at representative time points as indicated by the numbers (min) at the y-axis. The peak numbers refer to those assigned to structures in Figures 1, 7: 2-F-BzCoA (1), F-1,5-dienoyl-CoA (2 and/or 2∗), 6-oxo-1-enoyl-CoA (7), 3-OH-pimeloyl-CoA (8), F-1-enoyl-CoA (10) and F-OH-1-enoyl-CoA (11).
