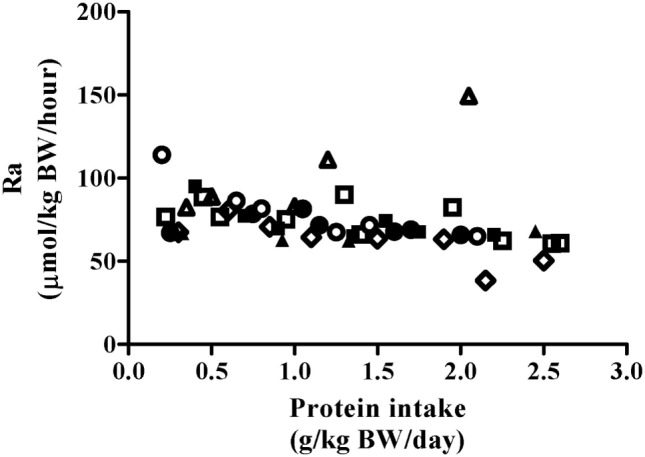
Figure 2.

Relationship between Phe Ra and protein intake after exercise stimulus. Each data point represents PheRa of the individual metabolic trial day. Shapes represent trials performed by an individual subject. The slope of the regression line was not significantly different from 0 (P = 0.45).
