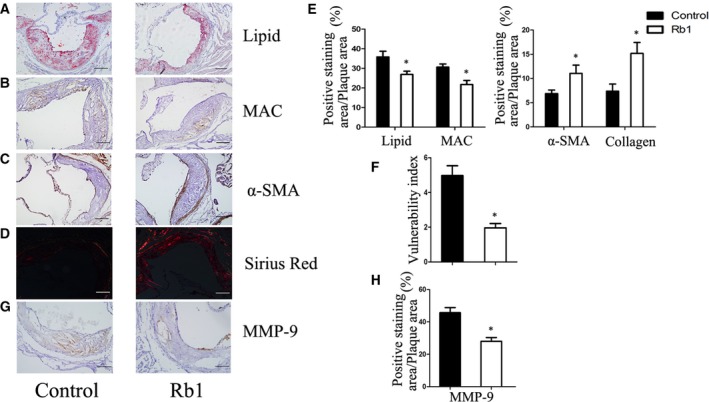
Figure 4.

Rb1 obviously increased AS plaque stability of atherosclerotic ApoE−/− mice. (A)(B)(C) Immnohistochemical staining of Oil red‐O staining of lipids, MOMA‐2 (macrophage marker), smooth muscle cells. (D) Representative images of Sirius Red‐staining for quantification of the lesion collagen content. (E) Statistics of (A)–(D) measured as area ratio. (F) Vulnerability index of plaque in corresponding groups calculated as (lipid deposit% + macrophages%) / (collagen fibres% + SMCs%). Data are means ± S.D.; Scale bar: 100 μm. *P < 0.05; n = 6. (G) (H) Representative immunohistochemistry and statistics of MMP‐9 expression. Quantification of the MMP‐9 positive staining area expressed as percentage of total lesion area. Data are presented as means ± S.D.; Scale bar: 20 μm. *P < 0.05; n = 6.
