Figure 6.

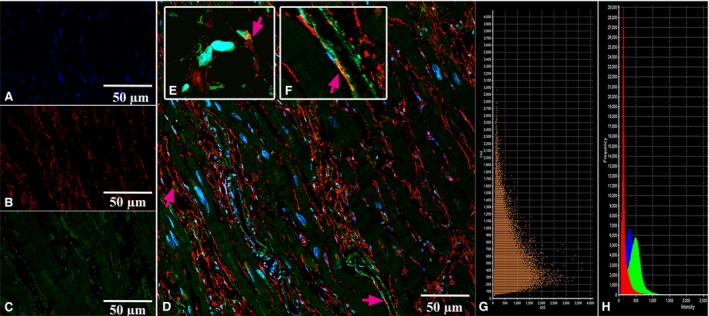
Patient 1 (Table 1). Laser confocal scanning microscopy of the working myocardium of right atrium (control). (A) Blue fluorescence of cell nuclei (DAPI). (B) Red fluorescence of CD34. (C) Green fluorescence of S100. (D, E, F) Coexpression of CD34 and S100 on the telocytes is visualized with yellow/orange colour (arrows). A, B, C, D: ×100. E,F (insert): ×900. (G) The scatterplot of the colocalization of S100 (ch2) and CD34 (ch3). (H) The intensity histograms of green (S100), red (CD34) and blue (DAPI) fluorescence. Figures G and H show the fluorescence intensity and the colocalization of the markers being studied and their quantitative levels.
