Figure 10.

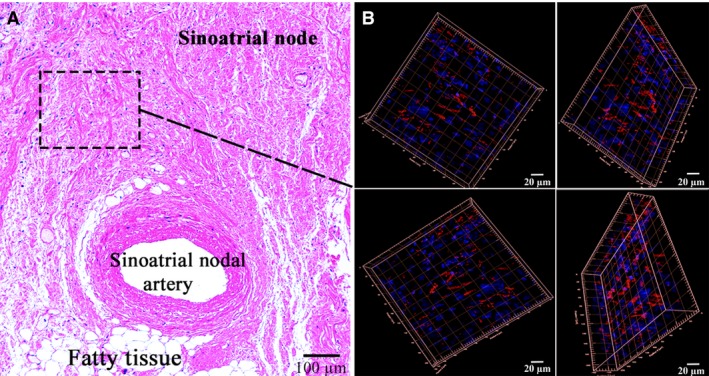
Patient 5 (Table 1). (A) The sinoatrial node (SAN); haematoxylin and eosin, ×200. (B) Laser confocal scanning microscopy of the SAN with 3D reconstruction (framed). Blue fluorescence of cell nuclei (DAPI). Red fluorescence of CD117; ×200.

Patient 5 (Table 1). (A) The sinoatrial node (SAN); haematoxylin and eosin, ×200. (B) Laser confocal scanning microscopy of the SAN with 3D reconstruction (framed). Blue fluorescence of cell nuclei (DAPI). Red fluorescence of CD117; ×200.