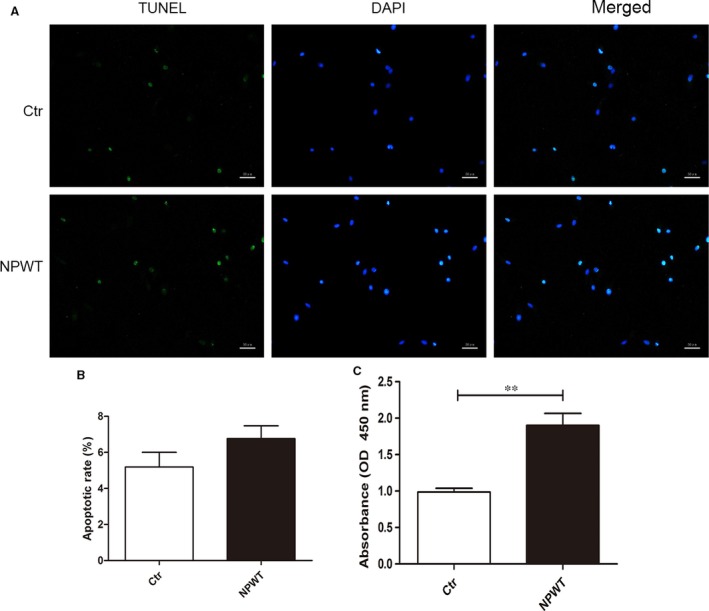
Figure 2.

Cell proliferation and apoptosis assay. During 3 days of treatment with NPWT, apoptosis of MDSCs was evaluated by TUNEL assay. The images of TUNEL + cells (green fluorescence) are shown in (A, bars = 50 μm), and percentages of apoptosis cells in clots are shown in (B). Compared with the control group, 3 days of NPWT did not result in a significant increase in cell apoptosis. (C) The cell viability was measured on 3 days by a CCK‐8 assay, and optical density values at 450 nm were measured. Compared with control cells, NPWT‐treated cells had a higher OD value (**P < 0.01).
