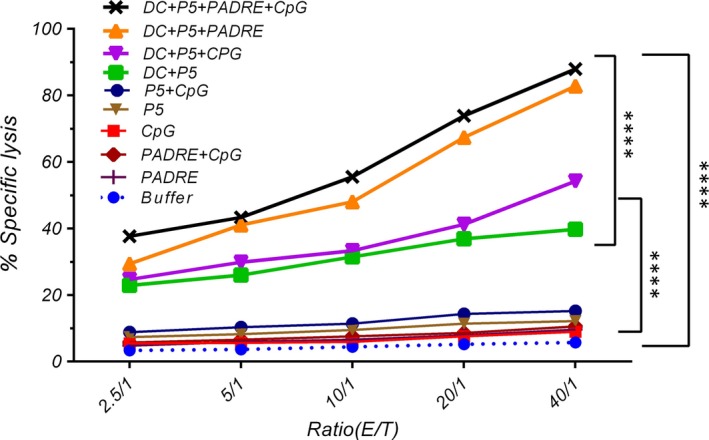
Figure 5.

Induction of specific CTL potency for tumour cell killing by the different formulations was assessed by in vitro CTL activity assay. Five different effector to target cell ratios were tested. HER2/neu‐expressing TUBO cells and CT26 cells (as a negative control) were labelled by Calcein AM and co‐incubated with different ratios of splenocytes. The data are expressed as means ± S.E.M.s (n = 3). E: effector cells and T: target cells. One‐way anova was employed and statistically significant differences are shown as follows: ns: P > 0.05, *P < 0.05, **P < 0.01, ***P < 0.001, ****P < 0.0001.
