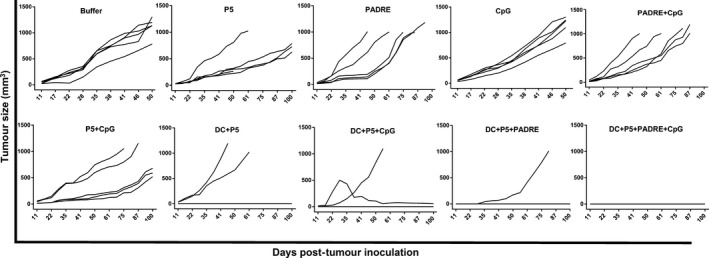
Figure 6.

Results of the formulations on TUBO tumour growth in mice. Two weeks after the final boosting dose, TUBO cells were injected into mice (n = 5). Tumours were measured and volumes recorded weekly. The values are means. Mice were monitored for 100 days. Data were analysed by the two‐way anova test and statistical significances were designated as follows: Ns: P > 0.05, *P < 0.05, **P < 0.01, ***P < 0.001, ****P < 0.0001.
