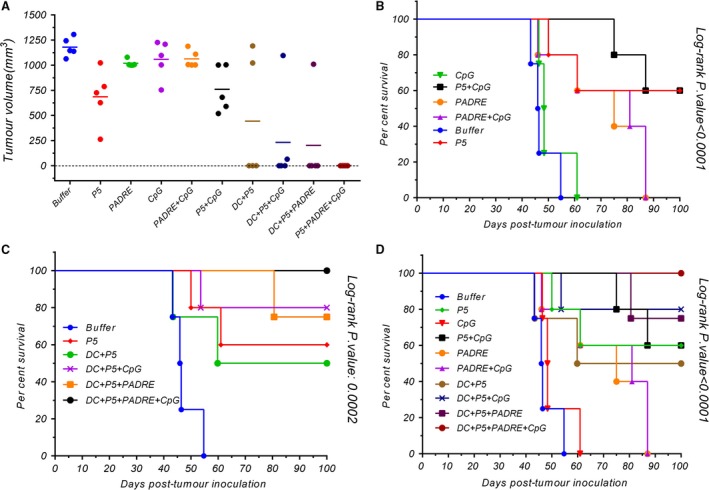
Figure 7.

The tumour mass scale based on tumour size in inoculated mice on their last survival days (A), and their survival (B, C and D) were monitored by the multiple comparison log‐rank (Mantel–Cox) test. Statistical significances were designated as follows: ns: P > 0.05, *P < 0.05, **P < 0.01, ***P < 0.001, ****P < 0.0001.
