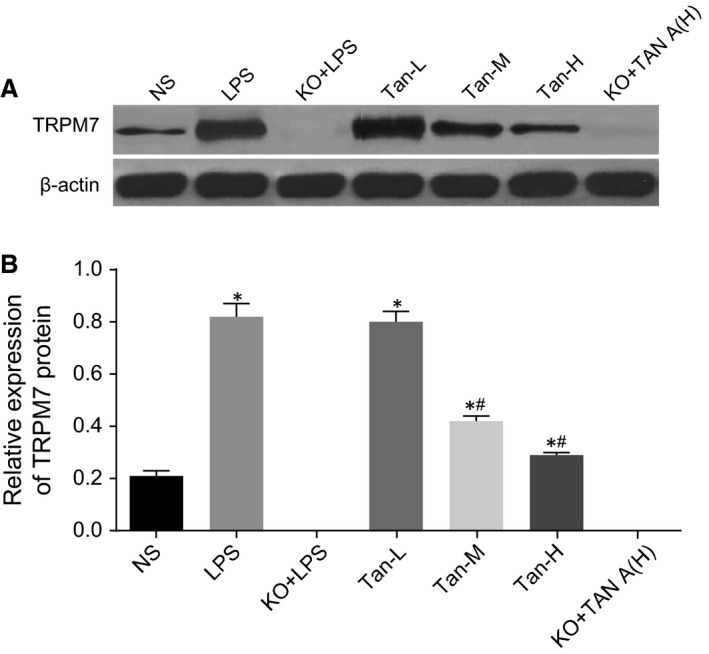
Figure 3.

Comparisons of TRPM7 protein expressions in the PIMs among seven groups. B and of TRPM7 protein for each group; B, TRPM7 protein expressions for each group; *P < 0.05, compared with the NS group; # P < 0.05, compared with the LPS group; NS: normal saline; LPS: lipopolysaccharide; Tan A (L): low‐dose Tanshinone IIA; Tan A (M): middle‐dose Tanshinone IIA; Tan A (H): high‐dose Tanshinone IIA; KO: knockout.
